
Impact evaluation. Page: Generic Do-Files (all): SO301 Quantitative Research Methods. Multilevel analysis. Logistic regression. Group trajectory based modelling using Stata. Stata Library: Panel Data Analysis using GEE. Stata Library Panel Data Analysis using GEE Note: This page uses Stata 11 syntax in the examples.
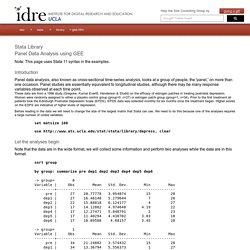
Introduction Panel data analysis, also known as cross-sectional time-series analysis, looks at a group of people, the 'panel,' on more than one occasion. Panel studies are essentially equivalent to longitudinal studies, although there may be many response variables observed at each time point. These data are from a 1996 study (Gregoire, Kumar Everitt, Henderson & Studd) on the efficacy of estrogen patches in treating postnatal depression. Before reading in the data we will need to change the size of the largest matrix that Stata can use. Set matsize 160 use clear Let the analyses begin Note that the data are in the wide format, we will collect some information and perform two analyses while the data are in this format. sort group by group: summarize pre dep1 dep2 dep3 dep4 dep5 dep6 -> group= 0 Variable | Obs Mean Std.
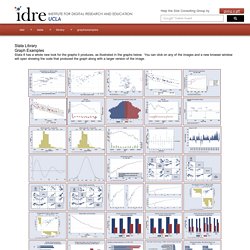
Let's check to see if the groups differ on the pretest depression score: Books about Stata. Stata Library: Graph Examples. BESbswy Welcome to the Institute for Digital Research and Education Institute for Digital Research and Education Home Help the Stat Consulting Group by giving a gift Stata LibraryGraph Examples Stata 8 has a whole new look for the graphs it produces, as illustrated in the graphs below.
This page was adapted from a page from the Stata Corporation web site and is provided on our site courtesy of, and copyright Stata Corporation. How to cite this page Report an error on this page or leave a comment The content of this web site should not be construed as an endorsement of any particular web site, book, or software product by the University of California. IDRE Research Technology Group High Performance Computing Statistical Computing. Laerd Statistics Premium Sample. What types of weights do SAS, Stata and SPSS support? Stata Frequently Asked Questions What types of weights do SAS, Stata and SPSS support?
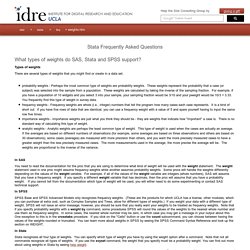
Types of weights There are several types of weights that you might find or create in a data set. probability weights - Perhaps the most common type of weights are probability weights. These weights represent the probability that a case (or subject) was selected into the sample from a population. In SAS You need to read the documentation for the proc that you are using to determine what kind of weight will be used with the weight statement. In SPSS SPSS Base and SPSS Advanced Models only recognizes frequency weights. In Stata Stata recognizes all four type of weights. The content of this web site should not be construed as an endorsement of any particular web site, book, or software product by the University of California.
Choosing the Correct Weight Syntax — UNC Carolina Population Center. Simple But Powerful Excel Tricks for Analyzing Data. Introduction I’ve always admired the immense power of Excel. This software is not only capable of doing basic data computations, but you can also perform data analysis using it. It is widely used for many purposes including the likes of financial modeling and business planning. It can become a good stepping stone for people who are new to the world of data analysis. Even before learning R or Python, it is advisable to have knowledge of Excel. Stata for Researchers: Combining Data Sets. This is part seven of the Stata for Researchers series.
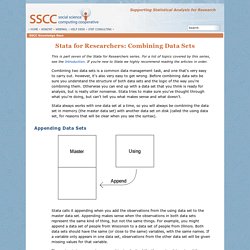
For a list of topics covered by this series, see the Introduction. If you're new to Stata we highly recommend reading the articles in order. Combining two data sets is a common data management task, and one that's very easy to carry out. However, it's also very easy to get wrong. Before combining data sets be sure you understand the structure of both data sets and the logic of the way you're combining them. Stata always works with one data set at a time, so you will always be combining the data set in memory (the master data set) with another data set on disk (called the using data set, for reasons that will be clear when you see the syntax). Stata FAQ: How can I combine a large number of files (e.g. one for each U.S. state)? Stata FAQ How can I combine a large number of files?
Large datasets sometimes come as a series of smaller datasets each containing information from a subset of cases. For example, one dataset for each U.S. State, or one dataset per year for data over a series of years. Stata Programming Tools. This article will introduce you to many Stata programming tools that are not needed by everyone but are very useful in certain circumstances.
The intended audience is Stata veterans who are already familiar with and comfortable using Stata syntax and fundamental programming tools like macros, foreach and forvalues. If you are new to Stata, our Stata for Researchers will teach you basic Stata syntax, and Stata Programming Essentials will teach you the fundamental programming tools. Unlike this article, they do not assume any Stata or general programming experience. Topics discussed in this article include: If you need to learn about a specific topic, feel free to skip to it. Compound Double Quotes. Stata. In this section we describe Stata data files, discuss how to read raw data into Stata in free and fixed formats, how to create new variables, how to document a dataset labeling the variables and their values, and how to manage Stata system files.
Stata 11 introduced a variables manager that allows editing variable names, labels, types, formats, and notes, as well as value labels, using an intuitive graphical user interface available under Data|Variables Manager in the menu system. While the manager is certainly convenient, we still prefer writing all commands in a do file to ensure research reproducibility. A nice feature of the manager, however, is that it generates the Stata commands needed to accomplish the changes, so it can be used as a learning tool and, as long as you are logging the session, leaves a record behind. Stata Programming Essentials. Ever needed to do the same thing to ten different variables and wished that you didn't have to write it out ten times?
If so, then this article is for you. If not, someday you will—so you might as well keep reading anyway. Stata has all the tools required to write very sophisticated programs, but knowing just a few of them allows you to make everyday do files shorter and more efficient. This article will focus on those programming tools that, in our experience, anyone who uses Stata heavily will eventually want to learn. Stata for Researchers: Working With Data. This is part three of the Stata for Researchers series.
For a list of topics covered by this series, see the Introduction. If you're new to Stata we highly recommend reading the articles in order. Now that you understand Stata's basic syntax, you're ready to start working with your data. This article will teach you how to make new variables, modify existing variables, and create labels. Frequency Distributions in Stata. Frequency Distributions in Stata Examples using the hsb2 dataset.
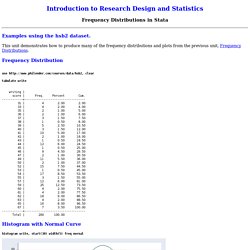
This unit demonstrates how to produce many of the frequency distributions and plots from the previous unit, Frequency Distributions. Frequency Distribution use clear tabulate write writing | score | Freq. Using Stata to Create Bar Graphs. Programming Stata. This section is a gentle introduction to programming Stata. We discuss macros and loops, and show how to write your own (simple) programs. This is a large subject and all we can hope to do here is provide a few tips that hopefully will spark your interest in further study. However, the material covered will help you use Stata more effectively. Stata 9 introduced a new and extremely powerful matrix programming language called Mata. This extends the programmer's tools well beyond the macro substitution tools discussed here, but Mata is a subject that deserves separate treatment. To learn more about programming Stata you should read Chapter 18 in the User's Guide and then refer to the Programming volume and/or the online help as needed. 4.1 Macros A macro is simply a name associated with some text. 4.1.1 Storing Text in Local Macros Local macros have names of up to 31 characters and are known only in the current context (the console, a do file, or a program).