
Ohno's Problem-Solving Methods. Experiments, as understood in the fields of science or engineering, means to verify or refute a hypothesis using a controlled and repeatable procedure.
The tests that make up the experiments are performed systematically and the results analyzed in an unbiased way using logical thinking. The scientific method is used when conducting experiments and consists of the following steps: Observe a phenomenonFormulate a hypothesis to explain the phenomenonConduct experiments to prove or disprove the hypothesisReach a conclusion that validates or modifies the hypothesis Trial and error is another type of problem-solving process but differs from experiments in important ways.
Someone attempts to do something many times in an unsystematic or uncontrolled way until they succeed (or give up). In recent years, people talk about conducting “experiments” to achieve a desired future state more than they talk about trial and error. “Mr. “Standardized work at Toyota is a framework for kaizen improvements. PDCA. PDCA (plan–do–check–act or plan–do–check–adjust) is an iterative four-step management method used in business for the control and continuous improvement of processes and products.
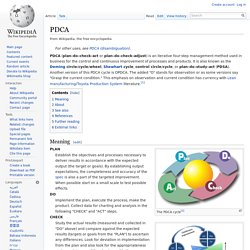
It is also known as the Deming circle/cycle/wheel, Shewhart cycle, control circle/cycle, or plan–do–study–act (PDSA). Another version of this PDCA cycle is OPDCA. The added "O" stands for observation or as some versions say "Grasp the current condition. " This emphasis on observation and current condition has currency with Lean manufacturing/Toyota Production System literature.[1] Meaning[edit] Continuous quality improvement with PDCA Establish the objectives and processes necessary to deliver results in accordance with the expected output (the target or goals). Implement the plan, execute the process, make the product. Study the actual results (measured and collected in "DO" above) and compare against the expected results (targets or goals from the "PLAN") to ascertain any differences.
About[edit] See also[edit] 5-why Analysis using an Excel Spreadsheet Table. Find out how to visualize your five-whys analysis by putting it into a spreadsheet, including a downloadable five why template and tutorial.
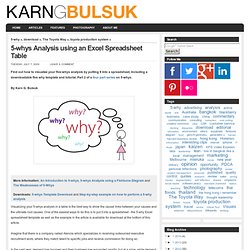
Part 2 of a four part series on 5-whys. By Karn G. Bulsuk More information: An Introduction to 5-whys, 5-whys Analysis using a Fishbone Diagram and The Weaknesses of 5-WhysDownloads: 5-whys Template Download and Step-by-step example on how to perform a 5-why analysis Visualizing your 5-whys analysis in a table is the best way to show the causal links between your causes and the ultimate root causes. Imagine that there is a company called Alencia which specializes in receiving outsourced executive recruitment work, where they match talent to specific jobs and receive commission for doing so. In the past year, demand has boomed and their business has expanded rapidly, but at a price: while demand has increased, capacity has remained the same, leading to a large back log of job requests.
Setting Up the Excel Sheet. Karn G. Bulsuk: Full Speed Ahead. As with all tools, 5-why analysis has its share of weaknesses.
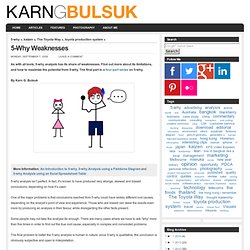
Using a Fishbone (or Ishikawa) Diagram to Perform 5-why Analysis. The fishbone (or Ishikawa) diagram is another way to visualize your 5-why analysis, and allows you to classify your analysis into broad categories. Part 3 of a four-part series on five-why. By Karn G. Bulsuk More information: An Introduction to 5-why, 5-why Analysis using a Fishbone Diagram and The Weaknesses of 5-Why The fishbone diagram, also known as the Ishikawa diagram, is another tool to provide you with a visual representation of your 5-why analysis. The strength of the fish bone diagram is that it allows you to focus on specific cause categories, which may help you to better focus your line of enquiry.
In this article, we will be using the same scenario as the table analysis example in the previous article. An opening tip… I strongly recommend using paper and pen when you perform the analysis, as it allows you to put your ideas down much quicker than a computer would. Firstly, on a sheet of paper, draw a long line with the box at the end. Effective Brainstorming: Building an Opportunity Matrix. Richard Miller March 18, 2011 Manufacturing facilities often are faced with major challenges when it comes to large-scale process improvement.
Improving yields at a large manufacturing plant – one that produces millions of pounds of product annually – might require modifications for every step in its process: production equipment, maintenance strategies, operational procedures, process control strategies and analytical support strategies, as well as its business strategy that decides what product is run, where and when. Each stage in the process can contribute potential root causes that might impact plant performance negatively.
To help keep track of these potential root causes and improvements, Belts may benefit from a methodology called the opportunity matrix. Over the years, I have applied this matrix to identify and systematically attack the root causes that process experts feel are likely to have the greatest impact on an organization’s performance.