
Targeted Learning R Packages for Causal Inference and Machine Learning. By Sherri RoseAssistant Professor of Health Care PolicyHarvard Medical School Targeted learning methods build machine-learning-based estimators of parameters defined as features of the probability distribution of the data, while also providing influence-curve or bootstrap-based confidence internals.
The theory offers a general template for creating targeted maximum likelihood estimators for a data structure, nonparametric or semiparametric statistical model, and parameter mapping. These estimators of causal inference parameters are double robust and have a variety of other desirable statistical properties. Targeted maximum likelihood estimation built on the loss-based “super learning” system such that lower-dimensional parameters could be targeted (e.g., a marginal causal effect); the remaining bias for the (low-dimensional) target feature of the probability distribution was removed. Of key importance are the two R packages SuperLearner and tmle. Resources for learning R. Big data sparks interest in statistical programming languages. Big data is driving the use of statistical programming languages, in particular the open source R language.
This month's edition of the Tiobe index, which assesses language popularity based on data from search engines, has the R language ranked 15th, after being 12th last month and 31st a year ago. "Thanks to the big data hype, computational statistics is gaining attention nowadays," Tiobe says in its assessment. Google Developers R Programming Video Lectures. Speed up your R code using a just-in-time (JIT) compiler.
This post is about speeding up your R code using the JIT (just in time) compilation capabilities offered by the new (well, now a year old) {compiler} package.
Specifically, dealing with the practical difference between enableJIT and the cmpfun functions. If you do not want to read much, you can just skip to the example part. As always, I welcome any comments to this post, and hope to update it when future JIT solutions will come along. Taking R to the Limit (High Performance Computing in R), Part 1. rCharts. Recently, I had blogged about two R packages, rCharts and rNVD3 that provided R users a lattice like interface to create interactive visualizations using popular javascript libraries.
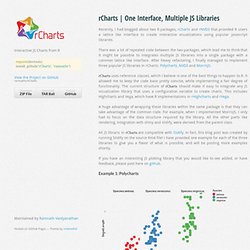
There was a lot of repeated code between the two packages, which lead me to think that it might be possible to integrates multiple JS libraries into a single package with a common lattice like interface. After heavy refactoring, I finally managed to implement three popular JS libraries in rCharts: Polycharts, NVD3 and MorrisJS. rCharts uses reference classes, which I believe is one of the best things to happen to R. It allowed me to keep the code base pretty concise, while implementing a fair degree of functionality. The current structure of rCharts should make it easy to integrate any JS visualization library that uses a configuration variable to create charts. A huge advantage of wrapping these libraries within the same package is that they can take advantage of the common code. Example 1: Polycharts. Package samplingVarEst. Taking R to the Limit (High Performance Computing in R), Part 2.
Statistics.org.il/wp-content/uploads/2010/04/Big_Memory V0.pdf. An Interactive Introduction To R (Programming Language For Statistics) Rserve-php - Rserve client php library. If you are into large data and work a lot with package ff. One of the main reasons why I prefer to use it above other packages that allow working with large datasets is that it is a complete set of tools.
If you disagree, do comment. Next to that there are some extra goodies allowing faster grouping by - not restricted to the ff package alone (Fast groupwise aggregations: bySum, byMean, binned_sum, binned_sumsq, binned_tabulate) > require(ffbase) > hhp <- read.table.ffdf(file="/home/jan/Work/RForgeBNOSAC/github/RBelgium_HeritageHealthPrize/Data/Claims.csv", FUN = "read.csv", na.strings = "") Mapping Public Opinion: A Tutorial « David B. Sparks. Mapping Public Opinion: A Tutorial Posted by d sparks on July 18, 2012 · 6 Comments At the upcoming 2012 summer meeting of the Society of Political Methodology, I will be presenting a poster on Isarithmic Maps of Public Opinion.
Since last posting on the topic, I have made major improvements to the code and robustness of the modeling approach, and written a tutorial that illustrates the production of such maps. This tutorial is in a very rough draft form, but I will post it here when it is finalized. (An earlier draft had some errors, and so I have taken it down.) Like this: R Offerings. Oracle has adopted R as a language and environment to support Statisticians, Data Analysts, and Data Scientists in performing statistical data analysis and advanced analytics, as well as generating sophisticated graphics.
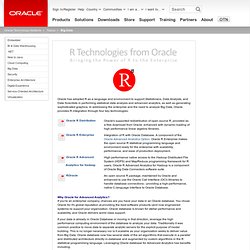
In addressing the enterprise and the need to analyze Big Data, Oracle provides R integration through four key technologies: Why Oracle for Advanced Analytics? If you're an enterprise company, chances are you have your data in an Oracle database. You chose Oracle for it's global reputation at providing the best software products (and now engineered systems) to support your organization. Oracle database is known for stellar performance and scalability, and Oracle delivers world class support. If your data is already in Oracle Database or moving in that direction, leverage the high performance computing environment of the database to analyze your data.
Oracle wants you to be successful with advanced analytics. Data Viz (R news & tutorials) An unabashedly narcissistic data analysis of my own tweets.
The… A big list of the things R can do. Step up your R capabilities with new tools for increased productivity « Stats raving mad. I guess a lot of us actually use many tools to accomplish various things in their everyday life.
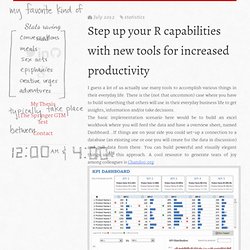
There is the (not that uncommon) case where you have to build something that others will use in their everyday business life to get insights, information and/or take decisions. The basic implementation scenario here would be to build an excel workbook where you will feed the data and have a overview sheet, named Dashboard…If things are on your side you could set-up a connection to a database (an existing one or one you will create for the data in discussion) and pull data from there.
You can build powerful and visually elegant things using this approach. A cool resource to generate tears of joy among colleagues is Chandoo.org. OK, we all love R. But what about interactive results? Unfortunately you will soon realize that building a highly interactive dashboard has limited added value for complex questions, like the ones that predictive analytics would bomb at your inbox. Fun with the googleVis Package for R.
Writing Fast R Code - Part 1. R news & tutorials from the web.