How to use optim in R. A friend of mine asked me the other day how she could use the function optim in R to fit data.
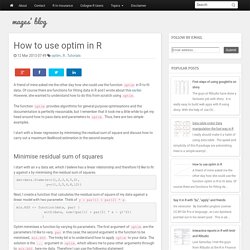
Of course there are functions for fitting data in R and I wrote about this earlier. However, she wanted to understand how to do this from scratch using optim. The function optim provides algorithms for general purpose optimisations and the documentation is perfectly reasonable, but I remember that it took me a little while to get my head around how to pass data and parameters to optim. Thus, here are two simple examples. I start with a linear regression by minimising the residual sum of square and discuss how to carry out a maximum likelihood estimation in the second example. Minimise residual sum of squares I start with an x-y data set, which I believe has a linear relationship and therefore I'd like to fit y against x by minimising the residual sum of squares. dat=data.frame(x=c(1,2,3,4,5,6), y=c(1,3,5,6,8,12))
An Introduction to <strong>corrplot</strong> package. Data Science Specialization Course Notes by Xing Su. Regression - Confusion related to elastic net. Untitled. By Joseph Rickert Even a casual glance at the R Community Calendar shows an impressive amount of R user group activity throughout the world: 45 events in April and 31 scheduled so far for May.

New groups formed last month in Knoxville, Tennessee (The Knoxville R User Group: KRUG) and Sheffield in the UK (The Sheffield R Users). An this activity seems to be cumulative. This month, the Bay Area R User’s Group (BARUG) expects to hold its 52nd and 53rd meet ups while the Sydney Users of R Forum (SURF) will hold its 50th. Everywhere R user groups are sponsoring high quality presentations and making them available online, but the Orange County R User Group is pushing the envelope with respect to sophistication and reach. Each curve represents a coefficient in the model. Created by Pretty R at inside-R.org Don’t be content with this partial example. Interpreting residual plots to improve your regression. When you run a regression, Statwing automatically calculates and plots residuals to help you understand and improve your regression model.
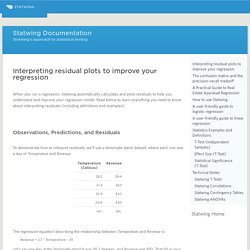
Read below to learn everything you need to know about interpreting residuals (including definitions and examples). Observations, Predictions, and Residuals To demonstrate how to interpret residuals, we’ll use a lemonade stand dataset, where each row was a day of Temperature and Revenue. The regression equation describing the relationship between Temperature and Revenue is Revenue = 2.7 * Temperature – 35 Let’s say one day at the lemonade stand it was 30.7 degrees, and Revenue was $50. So if we insert 30.7 at our value for Temperature… Revenue = 2.7 * 30.7 – 35 Revenue = 48 …we get $48. Your model isn’t always perfectly right, of course. Residual Plot. The residual data of the simple linear regression model is the difference between the observed data of the dependent variable y and the fitted valuesŷ.
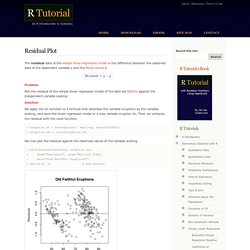
Problem Plot the residual of the simple linear regression model of the data set faithful against the independent variable waiting. Solution We apply the lm function to a formula that describes the variable eruptions by the variable waiting, and save the linear regression model in a new variable eruption.lm. Then we compute the residual with the resid function. > eruption.lm = lm(eruptions ~ waiting, data=faithful) > eruption.res = resid(eruption.lm) We now plot the residual against the observed values of the variable waiting.
Regression Diagnostics. Multiple Regression. Preliminaries Model Formulae If you haven't yet read the tutorial on Model Formulae, now would be a good time!
Statistical Modeling There is not space in this tutorial, and probably not on this server, to cover the complex issue of statistical modeling. For an excellent discussion, I refer you to Chapter 9 of Crawley (2007). Here I will restrict myself to a discussion of linear modeling. Glm( ) for generalized linear models (covered in another tutorial) gam( ) for generalized additive models lme( ) and lmer( ) for linear mixed-effects models nls( ) and nlme( ) for nonlinear models and I'm sure there are others I'm leaving out My familiarity with these functions is "less than thorough" (!)
Warning: an opinion follows! Preliminary Examination of the Data For this analysis, we will use a built-in data set called state.x77. > state.x77 # output not shown > str(state.x77) # clearly not a data frame! If you are unclear on what these variables are, or want more information, see the help page: ? A Modern Approach to Regression with R - Simon Sheather. Stepwise regression - Algorithms for automatic model selection. Regsubsets {leaps} Functions for model selection Description Model selection by exhaustive search, forward or backward stepwise, or sequential replacement Usage.
Multiple Regression. R provides comprehensive support for multiple linear regression.

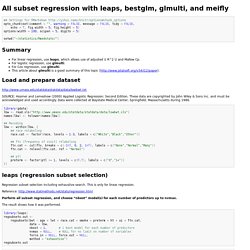
The topics below are provided in order of increasing complexity. Fitting the Model. Regression Smackdown: Stepwise versus Best Subsets! In my last post, I professed my fondness for regression analysis.

This time, I’m going compare two automatic tools that will help you to create a regression model. Imagine a scenario where you have many predictor variables and a response variable. Because there are so many predictor variables, you’d like some help in creating a good regression model. You could try a lot of combinations on your own. But, you’re in luck! All subset regression with leaps, bestglm, glmulti, and meifly. Opts_chunk$set(comment = "", warning = FALSE, message = FALSE, tidy = FALSE, echo = T, fig.width = 5, fig.height = 5)options(width = 100, scipen = 5, digits = 5) setwd("~/statistics/Rmedstats/") Summary.