
Placing Text in Plots. These examples demonstrate how to place text in a plot.
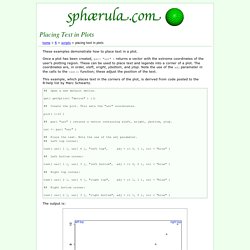
Once a plot has been created, par( "usr" ) returns a vector with the extreme coordinates of the user’s plotting region. These can be used to place text and legends into a corner of a plot. The coordinates are, in order, xleft, xright, ybottom, and ytop. Note the use of the adj parameter in the calls to the text() function; these adjust the position of the text. This example, which places text in the corners of the plot, is derived from code posted to the R-help list by Marc Schwartz. ## Open a new default device. get( getOption( "device" ) )() ## Create the plot. The output is: R: Demonstration of the Quincunx (Bean Machine/Galton Box)
Categories. Draw Easter Eggs. Lijia Yu (yu@lijiayu.net / GitHub / Twitter) A master candidate majoring in Bioinformatics at Beijing Institute of Genomics.
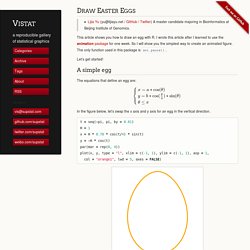
This article shows you how to draw an egg with R. I wrote this article after I learned to use the animation package for one week. So I will show you the simplest way to create an animated figure. The only function used in this package is ani.pause(). Let’s get started! A simple egg The equations that define an egg are: In the figure below, let’s swap the x axis and y axis for an egg in the vertical direction. t = seq(-pi, pi, by = 0.01) H = 1 x = H * 0.78 * cos(t/4) * sin(t) y = -H * cos(t) par(mar = rep(0, 4)) plot(x, y, type = "l", xlim = c(-1, 1), ylim = c(-1, 1), asp = 1, col = "orange1", lwd = 5, axes = FALSE) We need a Rotation matrix to draw the rotating egg: The ani.pause() function is called to pause for a time interval (by default specified in ani.options('interval')) and flush the current device. Another example: 3D eggs If you want to draw a 3D egg. References. Togaware: Hands-On Data Science with R.
How to use optim in R. A friend of mine asked me the other day how she could use the function optim in R to fit data.
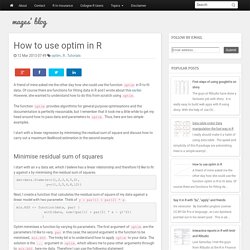
Of course there are functions for fitting data in R and I wrote about this earlier. However, she wanted to understand how to do this from scratch using optim. The function optim provides algorithms for general purpose optimisations and the documentation is perfectly reasonable, but I remember that it took me a little while to get my head around how to pass data and parameters to optim. Thus, here are two simple examples. I start with a linear regression by minimising the residual sum of square and discuss how to carry out a maximum likelihood estimation in the second example. Minimise residual sum of squares I start with an x-y data set, which I believe has a linear relationship and therefore I'd like to fit y against x by minimising the residual sum of squares. dat=data.frame(x=c(1,2,3,4,5,6), y=c(1,3,5,6,8,12)) K-means Clustering (from “R in Action”) In R’s partitioning approach, observations are divided into K groups and reshuffled to form the most cohesive clusters possible according to a given criterion.
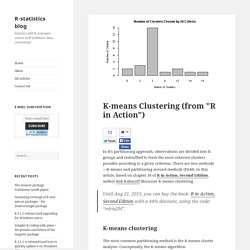
There are two methods—K-means and partitioning around mediods (PAM). In this article, based on chapter 16 of R in Action, Second Edition, author Rob Kabacoff discusses K-means clustering. Until Aug 21, 2013, you can buy the book: R in Action, Second Edition with a 44% discount, using the code: “mlria2bl”. K-means clustering The most common partitioning method is the K-means cluster analysis. Selects K centroids (K rows chosen at random)Assigns each data point to its closest centroidRecalculates the centroids as the average of all data points in a cluster (i.e., the centroids are p-length mean vectors, where p is the number of variables)Assigns data points to their closest centroidsContinues steps 3 and 4 until the observations are not reassigned or the maximum number of iterations (R uses 10 as a default) is reached.
Summary Related. Simpler R coding with pipes > the present and future of the magrittr package. Background It has only been 7 months and a bit since my initial magrittr commit to GitHub on January 1st.
It has had more success than I had anticipated, and it appears that I was not quite alone with a frustration which caused me to start the magrittr project. I am not easily frustrated with R, but after a few weeks working with F# at work, I felt it upon returning to R: I had gotten used to writing code in a different way — all nicely aligned with thought and order of execution. The forward pipe operator |> was so addictive that being unable to do something similar in R was more than mildly irritating. Reversing thought, deciphering nested function calls, and making excessive use of temporary variables almost became deal breakers! An amazing thing about R is that it is a very flexible language and the problem could be solved. Some_value |> some_function other_value The basics Maybe even easier?! R - Number of response patterns present in a matrix.
Response Patterns and Their Probabilities. R Programming Langauge. Practice_assignment/practice_assignment.rmd at master · derekfranks/practice_assignment.