
A gentle introduction to parallel computing in R – Win-Vector Blog. Let’s talk about the use and benefits of parallel computation in R.
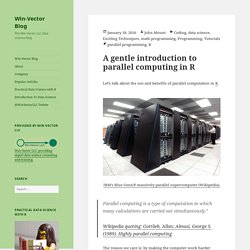
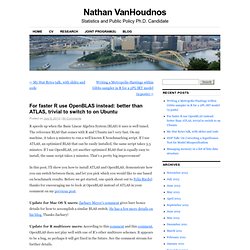
IBM’s Blue Gene/P massively parallel supercomputer (Wikipedia). Parallel computing is a type of computation in which many calculations are carried out simultaneously.”Wikipedia quoting: Gottlieb, Allan; Almasi, George S. (1989). Highly parallel computing The reason we care is: by making the computer work harder (perform many calculations simultaneously) we wait less time for our experiments and can run more experiments. This is especially important when doing data science (as we often do using the R analysis platform) as we often need to repeat variations of large analyses to learn things, infer parameters, and estimate model stability.
Typically to get the computer to work a harder the analyst, programmer, or library designer must themselves work a bit hard to arrange calculations in a parallel friendly manner. Your own machine. Functional programming in R. This post is based on a talk I gave at the Manchester R User Group on functional programming in R on May 2nd 2013.
The original slides can be found here This post is about functional programming, why it is at the heart of the R language and how it can hopefully help you to write cleaner, faster and more bug-free R programs. I will discuss what functional programming is at a very abstract level as a means of the representation of some simplified model of reality on a computer. Speeding up your R code - vectorisation tricks for beginners. ColorRampPaletteAlpha() and addalpha() – helper functions for adding transparency to colors in R. Is a very useful function in R for creating colors vectors to use as the palette, or to pass as an argument to a plotting function; however, a weakness lies in that it disregards the alpha channel of the colors passed to it when creating the new vector.
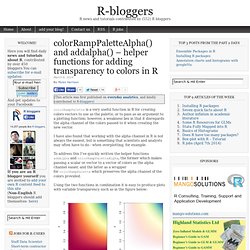
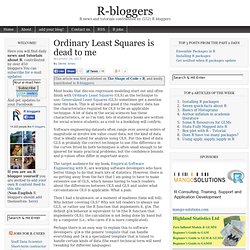
I have also found that working with the alpha channel in R is not always the easiest, but is something that scientists and analysts may often have to do - when overplotting, for example. To address this I've quickly written the helper functions addalpha and colorRampPaletteAlpha, the former which makes passing a scalar or vector to a vector of colors as the alpha channel easier, and the latter as a wrapper for colorRampPalette which preserves the alpha channel of the colors provided.Using the two functions in combination it is easy to produce plots with variable transparency such as in the figure below: I've also written examples of usage, which includes the figure above.
R 101: Summarizing Data. Using Dates and Times in R. Today at the Davis R Users’ Group, Bonnie Dixon gave a tutorial on the various ways to handle dates and times in R.
Bonnie provided this great script which walks through essential classes, functions, and packages. Here it is piped through knitr::spin. The original R script can be found as a gist here. Date/time classes Three date/time classes are built-in in R, Date, POSIXct, and POSIXlt.
How to use vectorization to streamline simulations. While grading some homework it became apparent that many of the idioms of R are not widely known and aren’t particularly intuitive to newcomers.

Two key features of R (and why I like the language so much) are vectorization and higher order functions. These features overlap with functional programming and form a powerful toolkit to implement models and run simulations with clear and concise code. For faster R use OpenBLAS instead: better than ATLAS, trivial to switch to on Ubuntu. R speeds up when the Basic Linear Algebra System (BLAS) it uses is well tuned.
The reference BLAS that comes with R and Ubuntu isn’t very fast. On my machine, it takes 9 minutes to run a well known R benchmarking script. If I use ATLAS, an optimized BLAS that can be easily installed, the same script takes 3.5 minutes. If I use OpenBLAS, yet another optimized BLAS that is equally easy to install, the same script takes 2 minutes. That’s a pretty big improvement! In this post, I’ll show you how to install ATLAS and OpenBLAS, demonstrate how you can switch between them, and let you pick which you would like to use based on benchmark results. University of British Columbia. These pages provide an introduction to R, emphasizing topics in data analysis that are covered in the graduate course, Biol 501: Quantitative methods in ecology and evolution.
Get R Download R from the CRAN website. Mac OS X users: If you are using R version 2, it is recommended that you also install the tcltk tools package ( This package is already included with R version 3. Get add-on packages R has a core set of command libraries (base, graphics, stats, etc), but there is a wealth of add-on packages available (the full list is available at the CRAN web site). Ordinary Least Squares is dead to me. Most books that discuss regression modeling start out and often finish with Ordinary Least Squares (OLS) as the technique to use; Generalized Least Squares (GLS) sometimes get a mention near the back.
This is all well and good if the readers’ data has the characteristics required for OLS to be an applicable technique. A lot of data in the social sciences has these characteristics, or so I’m told; lots of statistics books are written for social science students, as a visit to a bookshop will confirm. Software engineering datasets often range over several orders of magnitude or involve low value count data, not the kind of data that is ideally suited for analysis using OLS. For this kind of data GLS is probably the correct technique to use (the difference in the curves fitted by both techniques is often small enough to be ignored for many practical problems, but the confidence bounds and p-values often differ in important ways).
A brief introduction to “apply” in R. At any R Q&A site, you’ll frequently see an exchange like this one: Q: How can I use a loop to [...insert task here...] ?
A: Don’t. Use one of the apply functions. So, what are these wondrous apply functions and how do they work?