
Create a Glossary in R Markdown - Yongfu's Blog. I was thinking about creating a glossary in bookdown and found out that there was already an issue about it.
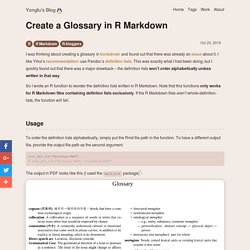
I like Yihui’s recommendation: use Pandoc’s definition lists. This was exactly what I had been doing, but I quickly found out that there was a major drawback – the definition lists won’t order alphabetically unless written in that way. So I wrote an R function to reorder the definition lists written in R Markdown. Note that this functions only works for R Markdown files containing defintion lists exclusively. If the R Markdown files aren’t whole-definition-lists, the function will fail. Usage To order the definition lists alphabetically, simply put the Rmd file path in the function. Sort_def_list("glossary.Rmd") The output in PDF looks like this (I used the multicol package): Source Code.
A new RStudio addin to facilitate inserting tables in Rmarkdown documents. In the last months, I started increasingly using Rmd documents for preparing scientific reports, blog posts, etcetera.
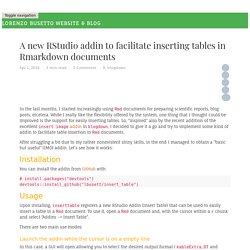
While I really like the flexibility offered by the system, one thing that I thought could be improved is the support for easily inserting tables. So, “inspired” also by the recent addition of the excellent insert image addin in blogdown, I decided to give it a go and try to implement some kind of addin to facilitate table insertion in Rmd documents. After struggling a bit due to my rather nonexistent shiny skills, in the end I managed to obtain a “basic but useful” (IMO) addin. Let’s see how it works: 10 tips for making your R graphics look their best.
So you've spent hours slaving over the code for a beautiful statistical graphic in R, and now you're ready to show it to the world.
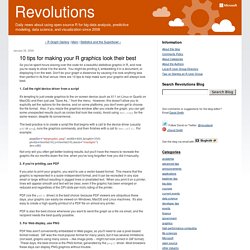
You might be printing it, embedding it in a document, or displaying it on the web. Don't do your graph a disservice by causing it to look anything less than perfect in its final venue. Here are 10 tips to help make sure your graphic will always look best. 1. Call the right device driver from a script It's tempting to just create graphics to the on-screen device (such as X11 on Linux or Quartz on MacOS) and then just use "Save As... " from the menu. The best practice is to create a script file that begins with a call to the device driver (usually pdf or png), runs the graphics commands, and then finishes with a call to dev.off(). Png(file="mygraphic.png",width=400,height=350)plot(x=rnorm(10),y=rnorm(10),main="example")dev.off() 2. If you plan to print your graphic, you want to use a vector-based format. 3. 4. 5. For PNG graphs, it's a bit tricker. Dev.off() 6. Tips and tricks for working with images and figures in R Markdown documents.
Writing reports in R Markdown allows you to skip painful and error-prone copy-paste in favor of dynamically-generated reports written in R and markdown that are easily reproducible and updateable. R Markdown reports that are heavy on graphs and maps, though, can yield large HTML files that are not optimized for web viewing.
R Markdown offers a wide range of functions and arguments for full control of image sizes but knowing how and when to use them can be daunting particularly given the differences in how external images are handled vs R-generated figures. We assembled this blog post to help guide you through image processing decision-making as you construct your own R Markdown reports. NOTE 1: This post is focused on the production of HTML documents and some of our conclusions and recommendations may not apply if you're using R Markdown to create a LaTeX document, PDF or Word document.
R Quick Tip: parameter re-use within rmarkdown YAML. Ever wondered how to make an rmarkdown title dynamic?
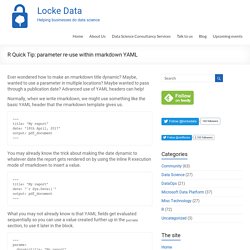
Maybe, wanted to use a parameter in multiple locations? Maybe wanted to pass through a publication date? Advanced use of YAML headers can help! Normally, when we write rmarkdown, we might use something like the basic YAML header that the rmarkdown template gives us. --- title: "My report" date: "18th April, 2017" output: pdf_document --- You may already know the trick about making the date dynamic to whatever date the report gets rendered on by using the inline R execution mode of rmarkdown to insert a value. --- title: "My report" date: "`r Sys.Date()`" output: pdf_document --- What you may not already know is that YAML fields get evaluated sequentially so you can use a value created further up in the params section, to use it later in the block. Reporting in a Repeatable, Parameterised, Transparent Way.
Earlier this week, I spent a day chatting to folk from the House of Commons Library as a part of a bit of temporary day-a-week-or-so bit of work I’m doing with the Parliamentary Digital Service.
During one of the conversations on matters loosely geodata-related with Carl Baker, Carl mentioned an NHS Digital data set describing the number of people on a GP Practice list who live within a particular LSOA (Lower Super Output Area). There are possible GP practice closures on the Island at the moment, so I thought this might be an interesting dataset to play with in that respect. How to set up your own R blog with Github pages and Jekyll Bootstrap. This post is in reply to a request: How did I set up this R blog?
I have wanted to have my own R blog for a while before I actually went ahead and realised this page. I had seen all the cool things people do with R by following R-bloggers and reading their newsletter every day! While I am using R every day at work, the thematic scope there is of course very bioinformatics-centric (with a little bit of Machine Learning and lots of visualization and statistics), I wanted to have an incentive to regularly explore other types of analyses and other types of data that I don’t normally work with. I have also very often benefited from other people’s published code in that it gave me ideas for my own work and I hope that sharing my own analyses will inspire others as much as I often am by what can be be done with data. Jupyter And R Markdown: Notebooks With R. When working on data science problems, you might want to set up an interactive environment to work and share your code for a project with others.

You can easily set this up with a notebook. In other cases, you’ll just want to communicate about the workflow and the results that you have gathered for the analysis of your data science problem. For a transparent and reproducible report, a notebook can also come in handy. That's right; notebooks are perfect for situations where you want to combine plain text with rich text elements such as graphics, calculations, etc. The topic of today's blog post focuses on the two notebooks that are popular with R users, namely, the Jupyter Notebook and, even though it's still quite new, the R Markdown Notebook. R Markdown: How to number and reference tables. R Markdown is a great tool to make research results reproducible.
However, in scientific research papers or reports, tables and figures usually need to be numbered and referenced. Unfortunately, R Markdown has no “native” method to number and reference table and figure captions. The recently published bookdown package makes it very easy to number and reference tables and figures (Link). However, since bookdown uses LaTex functionality, R Markdown files created with bookdown cannot be converted into MS Word (.docx) files. Dynamic Documents with RMarkdown and Knitr. Escape the Land of LaTeX/Word for Statistical Reporting: The Ecosystem of R Markdown Webinar. Getting started with R Markdown. “Mail merge” with RMarkdown.
The term “mail merge” might not be familiar to those who have not worked in an office setting, but here is the Wikipedia definition: Mail merge is a software operation describing the production of multiple (and potentially large numbers of) documents from a single template form and a structured data source.
Makefiles and RMarkdown. Quite some time ago (October 2013, according to Amazon), I bought a copy of “Reproducible Research with R and RStudio” by Christopher Gandrud.
And it was awesome. Since then, I’ve been using knitr and RMarkdown quite a lot. However, until recently, I never bothered with a makefile. At the time, I had assumed that it was something only available to people on *nix systems and back then I was developing exclusively on PC. I even wrote some R scripts that were more or less makefiles; reading the contents of a directory, checking for output and running render or knit or whatever. One weird trick to compile multipartite dynamic... < biochemistries. This afternoon I stumbled across this one weird trick an undocumented part of the YAML headers that get processed when you click the ‘knit’ button in RStudio.
Knitting turns an Rmarkdown document into a specified format, using the rmarkdown package’s render function to call pandoc (a universal document converter written in Haskell). If you specify a knit: field in an Rmarkdown YAML header you can replace the default function (rmarkdown::render) that the input file and encoding are passed to with any arbitrarily complex function. For example, the developer of slidify passed in a totally different function rather than render - slidify::knit2slides.
Make prettier documents by reusing chunks in RMarkdown. No revelations here, just a little R tip for generating more readable documents. Original with lots of code at the top There are times when I want to show code in a document, but I don’t want it to be the first thing that people see. What I want to see first is the output from that code. In this silly example, I want the reader to focus their attention on the result of myFunction(), which is 49. Function use before definition = error.
Rmarkdown: Alter Action Depending on Document. Can I see a show of hands for those who love rmarkdown? Yeah me too. One nifty feature is the ability to specify various document prettifications in the YAML of a .Rmd document and then use: The Problem. Lot of reports with a single click! Suppose you want to create a huge number of pdf files through RMarkdown and pandoc, each of them including a statistical analysis on a part of your data, for example on each row of your data frame.
You need to write a .R file with cycles from 1 to the number of rows of your data set the instructions contained in a .Rmd file. Suppose that: your data set name is data.csv and its path is datapath/data.csv’’your .Rmd file name is report.Rmd and its path is basepath/report.Rmd’’ An R code to produce pdf, where is the number of rows of your data set could be something like this: Embedding RData files in Rmarkdown files for more reproducible analyses.
For those of us interested in reproducible analysis, Rmarkdown is a great way of communicating our code to other researchers. Rstudio, in particular, makes it very easy to create attractive HTML document containing text, code, and figures, which can then be sent to colleagues or put on the internet for anyone to see.
Pander: A Pandoc writer in R. The main aim of the pander R package is to provide a minimal and easy tool for rendering R objects into Pandoc's markdown. The package is also capable of exporting/converting complex Pandoc documents (reports) in various ways. Regarding the difference between pander and other packages for exporting R objects to different file formats, please refer to this section. Current build and test coverage status: Some CRAN statistics: The stable version. Rmarkdown/pdf_document.R at master · rstudio/rmarkdown · GitHub.
Pandoc - Pandoc User’s Guide. Jimhester/knitrBootstrap · GitHub. Fast-track publishing using the new R markdown – a tutorial and a quick look behind the scenes. The new R Markdown (rmarkdown-package) introduced in Rstudio 0.98.978 provides some neat features by combining the awesome knitr-package and the pandoc-system. The system allows for some neat simplifications of the fast-track-publishing (ftp) idea using so called formats. I’ve created a new package, the Grmd-package, with an extension to the html_document format, called the docx_document. The formatter allows an almost pain-free preparing of MS Word compatible web-pages. In this post I’ll (1) give a tutorial on how to use the docx_document, (2) go behind the scenes of the new rmarkdown-package and RStudio ≥ 0.98.978, (3) show what problems currently exists when skipping some of the steps outlined in the tutorial. Tutorial on how to use ftp with the rmarkdown implementation A major improvement in the new rmarkdown is the YAML set-up.
As mentioned above, the Grmd-package also contains a formatter, the docx_document format that is a wrapper around the html_document. Interactive documents: An incredibly easy way to use Shiny. Floating table of contents for your html reports using knitr. If you love knitr and rstudio and use them to produce long reports, you probably know that you can produce a table of contents in your html (and pdf) documents. R Markdown v2. Ly — Plot with ggplot2 and plotly within knitr reports. Plotly is a platform for making, editing, and sharing graphs. If you are used to making plots with ggplot2, you can call ggplotly() to make your plots interactive, web-based, and collaborative. For example, see plot.ly/~marianne2/166, shown below.