5 of the Best Free and Open Source Data Mining Software
The process of extracting patterns from data is called data mining. It is recognized as an essential tool by modern business since it is able to convert data into business intelligence thus giving an informational edge. At present, it is widely used in profiling practices, like surveillance, marketing, scientific discovery, and fraud detection. There are four kinds of tasks that are normally involve in Data mining:
Graph
Graph Description In mathematics and computer science, graph theory studies networks of connected nodes and their properties. A graph can be used to visualize related data, or to find the shortest path from one node to another node for example.
Guías de muestra de transcripción
Style and Transcribing Each Scripto project requires guidelines or a style manual specific to the kinds of materials in the database. Your style manual takes into account the historic era of the materials, language and speech mannerisms, quality of the raw materials, whether wiki markup is needed to reproduce original formatting, and the desired outcome of the project. For example, should transcriptions maintains spelling and speech exactly as represented in the materials or is the focus on content and substance alone, regardless of stylistic idiosyncrasies? How will written transcriptions represent non-standard speech patterns or accents? The following samples are presented as broad guidelines, as suggestions guiding your development of project-relevant style manuals.
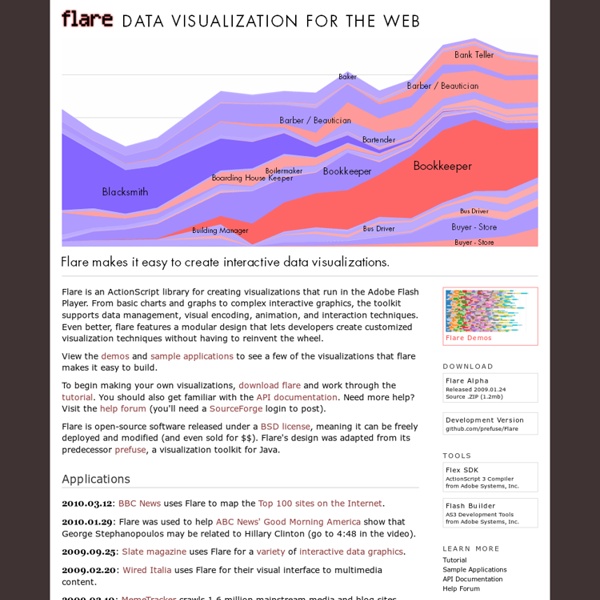
50 Great Examples of Data Visualization
Wrapping your brain around data online can be challenging, especially when dealing with huge volumes of information. And trying to find related content can also be difficult, depending on what data you’re looking for. But data visualizations can make all of that much easier, allowing you to see the concepts that you’re learning about in a more interesting, and often more useful manner. Below are 50 of the best data visualizations and tools for creating your own visualizations out there, covering everything from Digg activity to network connectivity to what’s currently happening on Twitter. Music, Movies and Other Media Narratives 2.0 visualizes music.
We love Infographics
INFOGRAPHICS // we love infographics // vol. 3 // Movies Infographics Trilogy Meter #1 Trilogy Meter #2 Kill Bill Facts Mega Shark vs.
Data Mining
Image: Detail of sliced visualization of thirty video samples of Downfall remixes. See actual visualization below. As part of my post doctoral research for The Department of Information Science and Media Studies at the University of Bergen, Norway, I am using cultural analytics techniques to analyze YouTube video remixes. My research is done in collaboration with the Software Studies Lab at the University of California, San Diego. A big thank you to CRCA at Calit2 for providing a space for daily work during my stays in San Diego. The following is an excerpt from an upcoming paper titled, “Modular Complexity and Remix: The Collapse of Time and Space into Search,” to be published in the peer review journal AnthroVision, Vol 1.1.
Cytoscape.js
This is how easy it is to get started with Cytoscape.js (this code creates the instance you see on the bottom-right: About Cytoscape.js is an open-source graph theory library written in JavaScript.
Transcript: makes transcribing easier
Welcome to Transcript 2.4, a program designed to help you to transcribe the text on digital images of documents. Transcript is free for private non commercial use . In all other cases it costs 15 euro.


