
Coronavirus Annotation. The COVID Tracking Project. COVID Data Tracker. COVID-19 Map - Johns Hopkins Coronavirus Resource Center. Pandemics Explained – unlocking evidence for better decision making. The Relationship Between Temperature and Fall Cases – A Case of Three Regions – Smart Remarks. Fall temps are negatively correlated with COVID-19 cases.

As it gets colder, people spend more time indoors, where the virus is more easily spread. Since Fall began COVID-19 has been surging again, but still varies dramatically by region. The Midwest is the hardest hit region. Meanwhile, cases in the Northeast are on the rise, but still lower than any other area. Looking at a trend line that takes this into account, we see a decent fit – over half the variation can be explained by the average Fall temperature for a state (expressed in degrees Fahrenheit) along with three regional categories (Midwest, South and West combined, and Northeast. The y-axis is the number of new cases in the last week per 1,000 people. Note that there is some overlap between regions. Tracking Our COVID-19 Response - covidexitstrategy.org.
The COVID Tracking Project. Coronavirus Pandemic Data Explorer. Third Surge Brings Record-Breaking Case Rates Across the Nation, This Week in COVID-19 Data, Oct 29. This week’s update is brought to you by Artis Curiskis, Alice Goldfarb, Erin Kissane, Júlia Ledur, Alexis Madrigal, Jessica Malaty Rivera, Charlotte Minsky, Kara Oehler, Joanna Pearlstein, Sara Simon, Peter Walker, and Nadia Zonis.
The United States set a new record for reported cases this week, breaking 500,000 for the first time in the pandemic as the third surge continued to build across nearly every state in the country. Twenty-five states have set a new record for cases in the last two weeks, including 17 states with record highs since last Wednesday. The country reported a record number of tests at 8.2 million, but case growth (24 percent) far outpaced test growth (9 percent), as we explained earlier this week. That’s also true for the entire month of October: Forty-seven of the 50 states, along with the District of Columbia, have seen cases rise faster than reported tests since October 1. Hospitalizations continue to rise Swing states are surging. COVID Data Tracker. Mortality Risk of COVID-19 - Statistics and Research. FastStats - Homepage. US Coronavirus Cases and Deaths. A vaccine, or millions of deaths: How America can build herd immunity to the coronavirus - Washington Post.
COVID Cases since June by state partisanship. The numbers are the total confirmed normalized* cases per million for each state since June.
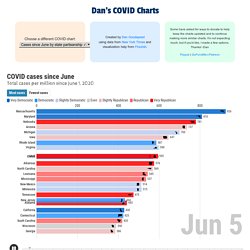
A '10,000' means 1% of the state's population has tested positive of COVID since June 1. June 1 was chosen as it was around that time that countries worldwide that had been sucker-punched months before had the opportunity to apply proven preventative measures. It also provided an opportunity to contrast the resulting data with states' political affiliations, using the Cook Partisan Voting Index.
The results suggest a strong correlation between a state's political leanings and its ability to employ proven science to slow the spread of COVID. * "Normalization" means the abnormalities in the data were evened out. Is US COVID-19 Case Total Highest Globally Due to 'Great Testing'? As governments fight the COVID-19 pandemic, Snopes is fighting an “infodemic” of rumors and misinformation, and you can help.

Read our coronavirus fact checks. Submit any questionable rumors and “advice” you encounter. Become a Founding Member to help us hire more fact-checkers. And, please, follow the CDC or WHO for guidance on protecting your community from the disease. Since the early months of the U.S. Coronavirus Updates (COVID-19) Deaths & Cases per 1M Population. Subscribe Sign In | Subscribe Ad-Free RCP Coronavirus Tracker Coronavirus (COVID-19) Global Deaths Coronavirus (COVID-19) U.S.

Deaths Sign Up for Latest Updates. Home - Johns Hopkins Coronavirus Resource Center. Tracking COVID-19 in the United States. s41567 020 0921 x. Main. The COVID Tracking Project. Our public data API provides access to all of our data at a national and state level.
We provide data in both JSON and CSV format. You can also download CSV data directly. All dates and times are in US eastern time (ET). Each state has its own set of caveats, which we have documented on our data page. Our data is provided under our project-wide data license. Fields may over time be marked as deprecated. COVID-19 Event Risk Assessment Planning Tool. An interactive visualization of the exponential spread of COVID-19. The Path to Zero: Key Metrics For COVID Suppression – Pandemics Explained. Harvard Global Health Institute, Harvard's Edmond J.
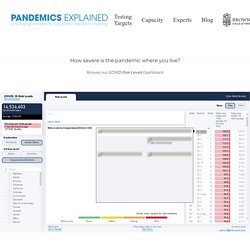
Safra Center for Ethics, Rockefeller Foundation, CovidActNow, Covid-Local, CIDRAP and many others join forces, launch new COVID Risk Level map and COVID suppression guidance for policy makers and the public Cambridge, July 1, 2020 -- Uncertainty is the currency of pandemics. As evidence on the new coronavirus, how it spreads and who falls ill from it emerges slowly, policy makers and the public have to base their decisions on the best information available.
Experts help interpret the evidence, but they may differ on details that can be confusing for non-experts -- and filtering out what matters from a rising sea of misinformation has become a daunting task. To help cut through the noise and sometimes conflicting advice, a network of research, policy and public health experts convened by Harvard’s Global Health Institute and Edmond J. “Robust TTSI programs are key on the pathway to suppression. Timeline of COVID-19 policies, cases, and deaths in your state - Johns Hopkins Coronavirus Resource Center. Stochasticity heterogeneity transmission dynamics SARS CoV 2. 2020 05 21 COVID19 Report 23. EndCoronavirus.org. RAND Corporation Provides Objective Research Services and Public Policy Analysis. The Covid-19 Tracker. As the virus that causes Covid-19 spreads worldwide, this dashboard offers a snapshot of the crisis right now.
Click on a country name to get a more detailed geographic breakdown at the state, province, or county level. Please note that because of limited testing capacity in some areas, the actual number of cases is believed to be higher. The datasets are drawn from over 15 sources and can be reviewed here. In some cases, data on hospitalizations were not available. This dashboard was produced through a partnership between STAT and Applied XL, a Newlab Venture Studio company. Hospitalized data is only collected for certain U.S. states. COVID-19 Scenarios.
IDSS COVID-19 Collaboration (Isolat) - IDSS. Isolat: a data-driven approach to addressing the COVID-19 pandemic IDSS COVID-19 Collaboration (Isolat) is a volunteer collaboration organized by IDSS to provide systematic and rigorous analyses of data associated with the Covid-19 pandemic in order to inform policy makers.
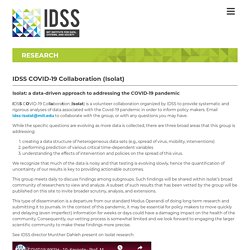
Email idss-isolat@mit.edu to collaborate with the group, or with any questions you may have. While the specific questions are evolving as more data is collected, there are three broad areas that this group is addressing: creating a data structure of heterogeneous data sets (e.g., spread of virus, mobility, interventions)performing prediction of various critical time-dependent variablesunderstanding the effects of intervention and policies on the spread of this virus. We recognize that much of the data is noisy and that testing is evolving slowly, hence the quantification of uncertainty of our results is key to providing actionable outcomes. This group meets daily to discuss findings among subgroups. Highlighted Research.
Time Series Analysis Using ARIMA Model In R. Time series data are data points collected over a period of time as a sequence of time gap.
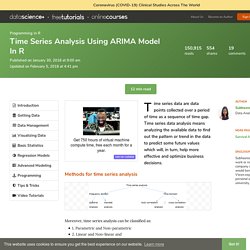
Time series data analysis means analyzing the available data to find out the pattern or trend in the data to predict some future values which will, in turn, help more effective and optimize business decisions. Methods for time series analysis. COVID-19 resources. View the COVID-19 projections This page was last updated at 2 p.m. Pacific, May 12, 2020. To view the changes to the model, please visit our estimation updates page. New Cases of COVID-19 In World Countries - Johns Hopkins Coronavirus Resource Center. Bayesian Model for COVID-19 Spread Prediction. Bayesian Model for COVID-19 Spread Prediction At present time, there are different methods, approaches, data sets for for modeling COVID-19 spread [1, 2, 3, 4, 5, 6]. For the predictive analytics of COVID-19 spread, we used a logistic curve model. Such model is very popular nowadays. To estimate model parameters, we used Bayesian regression [7, 8, 9].
This approach allows us to receive a posterior distribution of model parameters using conditional likelihood and prior distribution. Where Date0 is a start day for observations in the historical data set, it is measured in weeks. Next figures show the predictions for coronavirus spread cases using current historical data: COVID-19 Outbreak Tracker.
Using both clinical and claims data from Caspian Insights, Cotiviti’s longitudinal data and analytics ecosystem, we have put together an outbreak tracker to help forecast which geographic areas may be impacted by COVID-19 in the immediate future. Use the controls in the upper-left corner to help you navigate the map. Darker areas indicate a forecast of potentially hidden outbreak that could emerge within seven to ten days, based on leading indicators in the signature care profile of COVID-19. While several of these geographic areas already have confirmed COVID-19 breakouts, the map demonstrates they may also have a growing population of unconfirmed cases. Cotiviti supports the guidance that all Americans diligently follow social distancing guidelines and stay-at-home orders to help flatten the curve and protect vulnerable populations from COVID-19.
Key takeaways for the week of April 27, 2020 CaliforniaTexasAlabamaIllinoisOklahoma DelawareMarylandHawaiiNorth CarolinaLouisiana Methodology. Smart Remarks – Thoughts on Risk Management, Aerospace Program Management, Cost Estimating, Statistics, Machine Learning, and Data Science. Our World in Data. New York State Flu Tracker - NYAPD. Influenza, often referred to as ‘flu’, is a contagious respiratory illness caused by influenza viruses. Seasonal flu epidemics occur yearly during the colder months.
Although the yearly impact of influenza varies, it affects the health of New Yorkers each season. Most people who get sick with flu will have mild illness and will recover in less than two weeks without medical care. Institute for Health Metrics and Evaluation. Coronavirus Dashboard. Coronavirus Spread Follows Exponential Function With 19% Daily Increase When Uncontrolled. Institute for Health Metrics and Evaluation. COVID-19. SOLIDARITY: a simple clinical trial of COVID-19 treatments. A story came out in Science yesterday saying the World Health Organization is launching a trial of what it believes are the the four most promising treatments for COVID-19 (a.k.a. SARS-CoV-2, novel coronavirus, etc.) The four treatment arms will be RemdesivirChloroquine and hydroxychloroquineRitonavir + lopinavirRitonavir + lopinavir + interferon beta plus standard of care as a control arm.
I find the design of this trial interesting. The WHO realizes that the last thing front-line healthcare workers want right now is the added workload of conducting a typical clinical trial. When a person with a confirmed case of COVID-19 is deemed eligible, the physician can enter the patient’s data into a WHO website, including any underlying condition that could change the course of the disease, such as diabetes or HIV infection. That may sound a little complicated, but by clinical trial standards the SOLIDARITY trial is shockingly simple. Data Science Central. The coronavirus likely can remain airborne. It doesn’t mean we’re doomed. When a new virus blasts out of the animals that harbored it and into people, experts can usually say, thank goodness it’s not like measles. That virus is more contagious than any others known to science: Each case of measles causes an astronomical 12 to 18 new cases, compared to about six for polio, smallpox, and rubella.
Each case of the new coronavirus is estimated to cause two to three others. The reason the measles is so, well, viral, is that the microbe is so small and hardy that it is able to stay suspended in the air where an infected person coughed or sneezed for up to two hours, making it one of the only viruses that can exist as a true aerosol. Simulating COVID-19 with Agent-Based Modeling. Substantial undocumented infection facilitates the rapid dissemination of novel coronavirus (SARS-CoV2) Abstract Estimation of the prevalence and contagiousness of undocumented novel coronavirus (SARS-CoV2) infections is critical for understanding the overall prevalence and pandemic potential of this disease. Coronavirus 2020: exponential growth. Smart Remarks – Thoughts on Risk Management, Aerospace Program Management, Cost Estimating, Statistics, Machine Learning, and Data Science.