
Untitled. Pink seesaws across US-Mexico border named Design of the Year 2020. A collection of bright pink seesaws that allowed people to interact over the US-Mexico border has won the prestigious Design of the Year award, with its creators saying they hoped the work encourages people to build bridges between communities.

The Teeter Totter Wall, which bridged across El Paso in Texas and Ciudad Juárez in Mexico during a 40-minute session, was described as not only feeling “symbolically important” but also highlighting “the possibility of things” by the judging panel. The creators of the seesaws, Ronald Rael, a professor of architecture at the University of California, Berkeley, and Virginia San Fratello, an associate professor of design at San José State University, first came up with the idea a decade ago after the Secure Fence Act 2006, which started large-scale building on the border. They said they hoped the design would help people reassess the effectiveness of borders and encourage dialogue rather than division. Untitled. Untitled. Untitled. YouTube. HuffPost is now part of Verizon Media. HuffPost is part of Verizon Media.

Verizon Media and our partners need your consent to access your device and use your data (including location) to understand your interests, and provide and measure personalised ads. Verizon Media will also provide you with personalised ads on partner products. Learn more. To give you a better overall experience, we want to provide relevant ads that are more useful to you.
For example, when you search for a film, we use your search information and location to show the most relevant cinemas near you. Learn more about how Verizon Media collects and uses data and how our partners collect and use data. Select 'OK' to continue and allow Verizon Media and our partners to use your data, or select 'Manage options' to view your choices. Why aren't we living longer? Image copyright Yuri_Arcurs/Getty For the best part of two centuries people's life expectancy has been improving at a pretty rapid and consistent rate.

In the 1840s people did not live much past 40 on average. But then improvements in nutrition, hygiene, housing and sanitation during the Victorian period meant by the early 1900s life expectancy was approaching 60. As the 20th Century progressed, with the exception of the war years, further gains were made with the introduction of universal health care and childhood immunisations. From the 1970s onwards, medical advances in the care of stroke and heart attack patients in particular, saw big strides continue to be made So much so that by the start of the 21st Century, life expectancy at birth had reached 80 for women and 75 for men. And so it continued, with an extra year of life being added every four years or so. But then it suddenly stopped - or rather rapidly slowed. A blip or long-term trend? The world’s 7.5 billion people, in one chart. Our world has never been more connected than it is today.
Nearly two-thirds of the world’s population is plugged into the matrix, with over 4.4 billion internet users across multiple device types. We use these devices for work and for play—and social media has altered the way we interact both online and offline. Today’s infographic from Global Web Index compares key generational and regional differences of social media use based on data from nearly 114,000 internet users, highlighting how pervasive social media has become in our lives.
Note: China is excluded from the usage data regarding specific social networks and apps. From Age to Age: Social Media by Generation. Migration data: Why is it so hard to count people? The UK's Office for National Statistics (ONS) has downgraded the reliability of its own method for measuring migration, after discovering serious flaws in its methodology.

So do we ever really know the scale of UK migration? The headline migration figure is the number of people arriving in the UK who are planning to stay for at least a year, minus the people who are leaving the UK and planning to be away for at least a year. The latest figures for net migration from the European Union estimate that in the year to the end of March, 59,000 more EU citizens came to the UK than left.
That is the lowest figure since 2013. But that number is not the full story. This is of little surprise to experts who have repeatedly warned of shortcomings. How has it been counting migrants? Every three months the ONS publishes a migration update. For 362 days a year, cheerful IPS staff bounce in front of travellers at 19 airports, 10 ports and the Channel Tunnel rail link. Here is how it works. Using new data. A Century of Census. Global population shift raises challenges, and opportunities. India's population growth will come to an end: the number of children has already peaked.
India will soon become the world's most populous country as India's population is predicted to surpass that of China within the next decade.
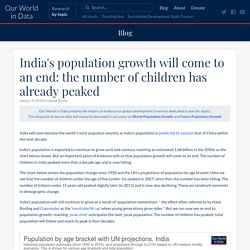
India's population is expected to continue to grow until mid-century, reaching an estimated 1.68 billion in the 2050s as the chart below shows. But an important piece of evidence tells us that population growth will come to an end: The number of children in India peaked more than a decade ago and is now falling. The chart below shows the population change since 1950 and the UN's projections of population by age bracket. Here we see that the number of children under the age of five (under-5s) peaked in 2007; since then the number has been falling. The number of Indians under 15 years old peaked slightly later (in 2011) and is now also declining. Click to open interactive version. The families returning to Poland as Brexit approaches. The Poles Are Coming.