
The Atlas of Economic Complexity. It’s Not Easy to Map the 100 Largest Islands in the World. Islands are tricky things.
They’re hard to define. (Must they always be surrounded by water? What about ecosystems isolated on tops of mountains?) They’re also hard to count. (What, if anything, is too small to make the cut? A Kelvin wave enters the Atlantic, boosting the 2020 hurricane season peak. The peak of the Atlantic hurricane season is coming.
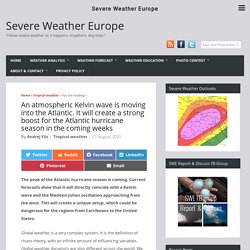
Current forecasts show that it will directly coincide with a Kelvin wave and the Madden-Julian oscillation approaching from the west. This will create a unique setup, which could be dangerous for the regions from Carribeans to the United States. Global weather is a very complex system. It is the definition of chaos theory, with an infinite amount of influencing variables. Global weather dynamics are also different across the world. Spring Flood Outlook 2020. Mississippi River Flood History 1543-Present. High Flows and Flood History on the Lower Mississippi River Below Red River Landing, LA (1543-Present) References AHPS E-19 - Advanced Hydrologic Prediction Service, Form E-19.
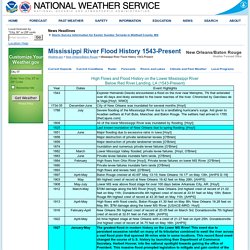
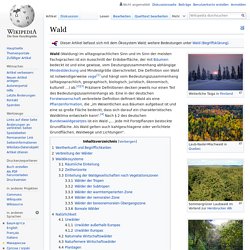
U.S. Department of Commerce, NOAA, National Weather Service Office of Hydrology web service. Barry, John M., "Rising Tide: The Great Flood of 1927 and how it changed America", New York: Simon & Schuster, 1998. 524 pages. Chin, Edwin H., J. Hoyt, William G. and W.B. Hurricane references: Grasshopper Geography. Grasshopper Geography. Global Change Data Lab. CO₂ and Greenhouse Gas Emissions. Pakko sanoa, pakko olla hiljaa – ilmastokriisini nyt. Wald. Laub-Nadel-Mischwald in Quebec Wortherkunft und Begrifflichkeiten[Bearbeiten | Quelltext bearbeiten] Das Wort Wald (althochdeutsch walt) beruht auf einem rekonstruierten urgermanischen *walþu ‚Büschel‘, in diesem Fall ‚Laubwerk‘, ‚Zweige‘, das seinerseits aus indogermanisch *wolɘt ‚dichtbewachsen‘ hervorgegangen sein könnte.
Karttapaikka - Maanmittauslaitos. Medieval Warm Period. Northern hemisphere temperature reconstructions for the past 2,000 years The Medieval Warm Period (MWP) also known as the Medieval Climate Optimum, or Medieval Climatic Anomaly was a time of warm climate in the North Atlantic region that may have been related to other warming events in other regions during that time, including China[1] and other areas,[2][3] lasting from c. 950 to c. 1250.[4] Other regions were colder, such as the tropical Pacific.
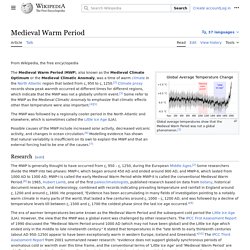
Averaged global mean temperatures have been calculated to be similar to early-mid 20th century warming. Possible causes of the Medieval Warm Period include increased solar activity, decreased volcanic activity, and changes to ocean circulation.[5] Initial research[edit] Evidence exists across the world, often very sparsely, for changes in climatic conditions over time. Globally[edit] North Atlantic[edit] North America[edit] 1690 copy of the 1570 Skálholt map, based on documentary information about earlier Norse sites in America. Africa[edit] Plastic Sources. Plastics in the marine environment have become a major concern because of their persistence at sea, and adverse consequences to marine life and potentially human health.
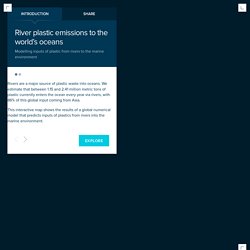
Implementing mitigation strategies requires an understanding and quantification of marine plastic sources, taking spatial and temporal variability into account. Here we present a global model of plastic inputs from rivers into oceans based on waste management, population density and hydrological information. Our model is calibrated against measurements available in the literature. We estimate that between 1.15 and 2.41 million tonnes of plastic waste currently enters the ocean every year from rivers, with over 74% of emissions occurring between May and October. The top 20 polluting rivers, mostly located in Asia, account for 67% of the global total. 90% of plastic polluting our oceans comes from just 10 rivers. Over the last decade we have become increasingly alarmed at the amount of plastic in our oceans.
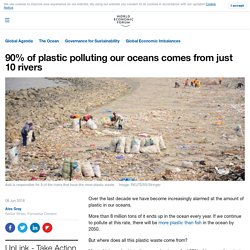
More than 8 million tons of it ends up in the ocean every year. If we continue to pollute at this rate, there will be more plastic than fish in the ocean by 2050. But where does all this plastic waste come from? Most of it is washed into the ocean by rivers. The world’s 7.5 billion people, in one chart. Our world has never been more connected than it is today. Nearly two-thirds of the world’s population is plugged into the matrix, with over 4.4 billion internet users across multiple device types. We use these devices for work and for play—and social media has altered the way we interact both online and offline. Today’s infographic from Global Web Index compares key generational and regional differences of social media use based on data from nearly 114,000 internet users, highlighting how pervasive social media has become in our lives.
Note: China is excluded from the usage data regarding specific social networks and apps. From Age to Age: Social Media by Generation. Population Mountains. Talented Photographer (Anjan Ghosh) Shares Life In India With The World. Human Terrain. Facebook. A Dutch 'boy genius' said he could get the ocean to clean itself. Turns out, he's right.
Maps - ESDAC - European Commission. Tree cover of Europe. A global map of wind, weather, and ocean conditions.