
Raphaël—JavaScript Library. 1.3.15 - flowchart connectors demonstration - jQuery. A JavaScript library that aims to make in-browser drawing very, very easy. Zoomooz.js. Zoomooz is: 6KB gzipped and 18KB minified.
This includes everything but jQuery. Make any web page zoom. Latest version: 1.1.9 (Nov 11, 2013, hacky fix for the back and forward buttons #66) Zoomooz is a jQuery plugin for making web page elements zoom. It can be used for making Prezi like slideshows and for zooming to images or other details. Quirky transformations You can zoom to elements that have been translated, scaled and skewed, and they will morph correctly. Try by clicking on these: Skew Scale Rotate There is some interesting stuff happening in the background to make the morphings work. Adding Zoomooz to your web page Just add this to your web page head and you should be up and running with Zoomooz: The easy way to zoom Simply add "zoomTarget" to the element you want to zoom to when clicked on: <div class="zoomTarget">This element zooms when clicked on.
You can also add some additional attributes for tuning the animation as data fields of the element: Here is a demo, click on the elements: Demos. Edit this Fiddle. Js-mindmap demo - JavaScript Mindmap. D3.js - Data-Driven Documents. Force-Directed Graph. This simple force-directed graph shows character co-occurence in . A physical simulation of charged particles and springs places related characters in closer proximity, while unrelated characters are farther apart.
Layout algorithm inspired by Tim Dwyer and Thomas Jakobsen . Data based on character coappearence in Victor Hugo’s , compiled by Donald Knuth . Source Code. Force-based label placement. Hive Plots. Showing 764 dependencies among 220 classes.
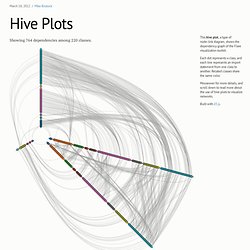
Many methods of graph drawing, such as force layouts, do not assign intrinsically-meaningful positions to nodes: the position is only approximate, in the hope that related nodes appear nearby. While intuitive, these methods arguably make poor use of the most effective visual channel (that is, position), and in the worst case produce an indecipherable hairball. Enter Krzywinski’s hive plot. Hive plots define a linear layout for nodes, grouping nodes by type and arranging them along radial axes based on some property of data. The explicit position encoding has the potential to better reveal the network structure while communicating additional information. Each node above represents a class in a software library. This grouping immediately reveals much about the different classes. Want more? Special thanks to Rich Morin for assisting in the implementation of hive plots in D3! NCAA Men's Basketball Tournament Bracket, 2012 - The Power Rank. Building Node Diagrams in HTML5.
As a follow up to this blog post by Steve, I’d like to share our progress on building a node diagram for network monitoring and to visualize network flow data.
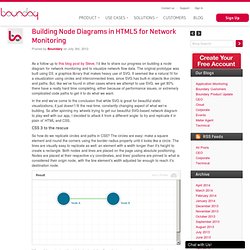
The original prototype was built using D3, a graphics library that makes heavy use of SVG. It seemed like a natural fit for a visualization using circles and interconnected lines, since SVG has built-in objects like circles and paths. But, like we’ve found in other cases where we attempt to use SVG, we get 80% there have a really hard time completing, either because of performance issues, or extremely complicated code paths to get it to do what we want. In the end we’ve come to the conclusion that while SVG is great for beautiful static visualizations, it just doesn’t fit the real-time, constantly changing aspect of what we’re building. CSS 3 to the rescue So how do we replicate circles and paths in CSS? Where things start getting tricky is simulating lines that appear to connect between nodes at arbitrary angles. Not quite.