
Creating an Excel Table. Unpivot or Reshape data - Excel Data Analytics. How to unpivot using Excel and load it into PowerPivot. I had an interesting question today where someone send me a workbook that contained a flattened table like this: Now as a result we want to see the top 1 nr of products per country.
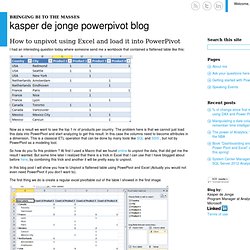
The problem here is that we cannot just load this data into PowerPivot and start analyzing to get this result. In this case the columns need to become attributes in a dimension. This is a classical ETL operation that can be done by many tools like SQL and SSIS , but not by PowerPivot as a modeling tool. So how do you fix this problem ? Transpose or Unpivot Entire Datasets with Data Explorer. So it’s been a while since my last post.
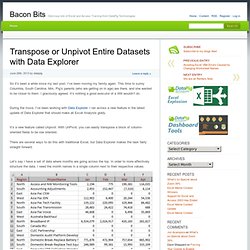
I’ve been moving my family again. This time to sunny Columbia, South Carolina. Mrs. Pig’s parents (who are getting on in age) are there, and she wanted to be closer to them. I graciously agreed. During the move, I’ve been working with Data Explorer. It’s a new feature called Unpivot. Let’s say I have a set of data where months are going across the top. I start by highlighting my entire range of data, then click the From Table command on the Data Explorer tab. SQL UNPIVOT Makes My Data Skinny. Guest post by David Churchward If you’re anything like me, you will have eagerly sucked data into PowerPivot, keen to get cracking with solving all of your reporting needs.

If you’re an Accountant (amongst others) doing this, you will no doubt have brought your trial balance dataset in and found endless columns of values representing monthly values. “How do I get time intelligence to work with this?” Is probably one of the first issues you’ve encountered and then, further down the line, when you’ve conjured up complex measures to resolve this problem, the words “why can’t I get this to run quicker” pass your lips. On this note, everyone should pay close attention to Less Columns, More Rows = More Speed! The New Internal Data Model in Excel 2013. I've been playing with Excel 2013 and finding some very cool features that I'd like to share.
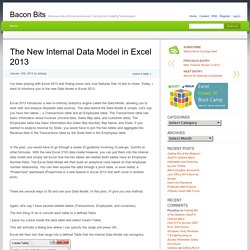
Today, I want to introduce you to the new Data Model in Excel 2013. Excel 2013 introduces a new in-memory analytics engine called the Data Model, allowing you to work with and analyze disparate data sources. The idea behind the Data Model is simple. Let's say you have two tables – a Transactions table and an Employees table.
The Transactions table has basic information about invoices (Invoice data, Sales Rep data, and Customer data). In the past, you would have to go through a series of gyrations involving VLookups, SumIfs or other formulas. There are several ways to fill and use your Data Model. Again, let's say I have several related tables (Transactions, Employees, and Locations). The first thing I'll do is convert each table to a defined Table. I place my cursor inside the data table and select Insert->Table. This will activate a dialog box where I can specify the range and press OK. Distinct Count in Pivot Tables – Finally in Excel 2013.
For as long as I can remember, Excel analysts have pleaded for a way to calculate Distinct Count in PivotTables.
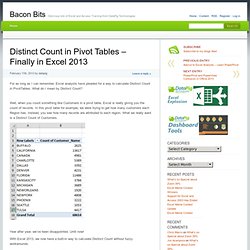
What do I mean by Distinct Count? Well, when you count something like Customers in a pivot table, Excel is really giving you the count of records. In this pivot table for example, we were trying to get how many customers each Region has. Instead, you see how many records are attributed to each region. Custom Calculations. In an Excel Pivot Table, you can use custom calculations to summarize the data, by using the values in other cells in the Values area.
For example, you can show each Region's total as a percentage of the national total. Or, calculate the difference between last week's sales and this week's. Video: Difference From To see the steps for creating a Difference From custom calculation, please watch this short video tutorial. The written instructions are below the video. Difference from You can use the Difference From custom calculation to subtract one pivot table value from another, and show the result. To change the total to a Difference From calculation, follow these steps: Right-click one of the Units value cells, and click Show Values As Click Difference From In the Show Values As dialog box, from the Base field list, choose Date.
Click the OK button, and the pivot table shows the differences in weekly sales. How to Index Data in a PivotTable. The INDEX function in a PivotTable calculates a weighted average by using the following formula: (value in cell) x (Grand Total)) / ((Grand Row Total) x (Grand Column Total)) When you use PivotTables to compare the relative importance of your row data versus your column data, it can be extremely helpful to display your data as an Index.
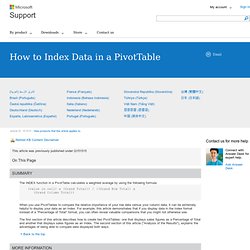
For example, this article demonstrates that if you display data in the Index format instead of a "Percentage of Total" format, you can often reveal valuable comparisons that you might not otherwise see. The first section of this article describes how to create two PivotTables: one that displays sales figures as a Percentage of Total and another that displays sales figures as an Index. The second section of this article ("Analysis of the Results"), explains the advantages of being able to compare data displayed both ways. 25 easy PivotTable reports. Petition to Microsoft. 6 New Updates in Power Query - PowerBI. Take Power Query to the next level: share your queries and create a corporate data catalog.

Try Power BI for Free today! In this Post October is getting close to an end, but before we all put on our costumes and eat lots of candy for Halloween, we are very pleased to give you another treat: the October Update for Power Query is now available! This update includes several feature improvements that we hope you will like. Here is what is new: Download the Power Query Update. Download Microsoft Power Query for Excel.