
County Health Rankings & Roadmaps. The Insane Growth Of China's And India's Megacities Mapped Through Satellite Imagery. Faced with the incomprehensible scale of worldwide mega-urbanization, observers have alternately fallen back on sheer numbers or city comparisons to drive home the speed at which cities in the developing world are growing.
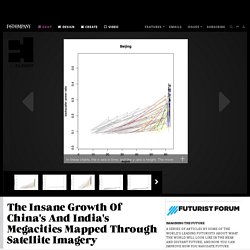
For example, New York University’s Shlomo "Solly" Angel projects the world’s urban population will double in 40 years, while urban land cover—including everything from skyscrapers to slums—will triple in size during that span. Grasping to put such numbers into context, the McKinsey Global Institute estimates China will build the equivalent of New York every other year for 20 years, while India needs to add the equivalent of a Chicago to its building stock annually. The mind reels, but such comparisons tell us little about the truth on the ground—is the urban future of India more likely to look like Chicago or Dharavi (Mumbai’s famous slum) or something else completely? A satellite designed to measure ocean winds offers us a clue.
The-world-as-100-people_51505a8baf475.png (PNG Image, 1370 × 1370 pixels) How much time do you spend traveling to work: Map. Jump to navigation Menu 🔊 Listen Transportation NationTransportation Share330Share95Share13 How much time do you spend traveling to work: Map Play Pause Support Us by Adriene Hill Tuesday, March 12, 2013 - 00:17 Story Census Poster: Mega-commuting in the U.S.

The average commute time is about 30 minutes. "One way to work is 90 minutes and 50 miles," says New York trader Pete Sylvestri. "It's got a beach, it's got great schools. And Sylvestri is pretty much the type of person that makes these mega-commutes. Alison Fields, with the Census Bureau, says they often work in fields like management and business. "They also tend to have a higher salary than the average commuter, they tend to be male and they tend to be in the prime working age," says Fields. HapMap. What are the Odds of Dying, Chances of Dying from various causes. Responding to frequent inquiries asking questions such as, "What are the odds of being killed by lightning?

" Injury_Facts_37.pdf (application/pdf Object) Mapping & Cartography. Broken and Obsolete « Fareed Zakaria. Broken and Obsolete Posted by Fareed Zakaria on June 8, 2012 · Leave a Comment An immigration deadlock makes the U.S. a second-rate nation By Fareed Zakaria As the American economy sags, the race for the presidency gets tighter—except in one dimension. Hispanic Americans continue to support Barack Obama by an astonishing 61%-to-27% margin. We think of ourselves as the world’s great immigrant society, and of course, for most of the country’s history, that has been true. Would you have guessed that Canada and Australia both have a higher percentage of foreign-born residents than the U.S.?
Canadian immigration policy is now centered on recruiting talented immigrants with abilities the country needs. The results of the system are evident in Vancouver, where American high-–technology companies like Microsoft have large research laboratories and offices. Sixty-two percent of permanent-resident visas in Canada are based on skills, while the remainder are for family unification.
Children of Immigrants Are America's Science Superstars. Adding fuel to the fiery debate over immigration policy, a study released Tuesday shows that top science achievers in the U.S. are overwhelmingly the children of immigrants.
The study, conducted by the National Foundation for American Policy, found that 70 percent of the finalists in the 2011 Intel Science Talent Search competition -- also known as the "Junior Nobel Prize" -- were the children of immigrants even though only 12 percent of the U.S. population is foreign-born. According to the report, children of immigrant parents have been increasingly dominant in the fields of math and science. In 2004, for example, researchers found that 60 percent of the top science students in the U.S. and 65 percent of the top math students were born to immigrant families. Findings were based upon data from the Intel Science Talent Search and the 2004 U.S. Math Olympiad. In particular, debate continues over reforming H1-B visa -- a temporary 3- to 6-year visa for skilled foreign workers. Interracial Marriage: Who and Where - Graphic - Pew Social & Demographic Trends. Distribution of Family Income - Gini Index.
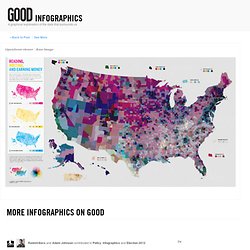
Are the Richest Americans Also the Best Educated? More Infographics on Good.
Mapping America — Census Bureau 2005-9 American Community Survey. The Connected States of America. The Golden Hour Calculator / Sunrise and Sunset. Worldmapper: The world as you've never seen it before. Peoplemovin - A visualization of migration flows.