
[E] Teaching the difference between sample and population variance : statistics. Different Types of Probability Distribution (Characteristics & Examples) - DatabaseTown. What is distribution?
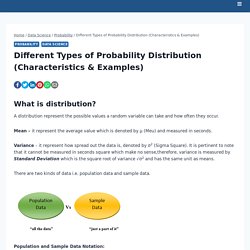
A distribution represent the possible values a random variable can take and how often they occur. Mean – it represent the average value which is denoted by µ (Meu) and measured in seconds. Variance – it represent how spread out the data is, denoted by σ2 (Sigma Square). It is pertinent to note that it cannot be measured in seconds square which make no sense,therefore, variance is measured by Standard Deviation which is the square root of variance √σ2 and has the same unit as means.
There are two kinds of data i.e. population data and sample data. Normal Distribution Generator. Statistics Notes: Standard deviations and standard errors. Standard error: meaning and interpretation - Biochemia Medica. Got it!
This website uses cookies to ensure you get the best experience on our website. More info Cookie Consent plugin for the EU cookie law Close. Standard error: meaning and interpretation - Biochemia Medica. Natural Variability and Chaos – One – Introduction. There are many classes of systems but in the climate blogosphere world two ideas about climate seem to be repeated the most.

In camp A: We can’t forecast the weather two weeks ahead so what chance have we got of forecasting climate 100 years from now. And in camp B: Weather is an initial value problem, whereas climate is a boundary value problem. On the timescale of decades, every planetary object has a mean temperature mainly given by the power of its star according to Stefan-Boltzmann’s law combined with the greenhouse effect. Of course, like any complex debate, simplified statements don’t really help. A simple method for detecting chaos in nature.
The Chaos Decision Tree Algorithm To understand the logic of the Chaos Decision Tree Algorithm21, we begin with the final test in the decision tree.
The crux of the Chaos Decision Tree Algorithm is the 0–1 test for chaos. The 0–1 test for chaos was originally developed by Gottwald and Melbourne37, who later offered a slightly modified version of the test, which can cope with moderate amounts of measurement noise38. Several years later, Dawes and Freeland further modified the test, such that it could suppress correlations induced by quasi-periodic dynamics, and thus more effectively distinguish between chaotic and strange non-chaotic dynamics, which are difficult to distinguish given only a time-series recording23. Normal Distribution. Normal Curves - Annenberg Learner. Chap4A. Q: What’s so special about the Gaussian distribution (i.e. the normal distribution / bell curve)?? Physicist: A big part of what makes physicists slothful and attractive is a theorem called the “central limit theorem”.
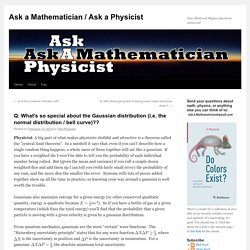
In a nutshell it says that, even if you can’t describe how a single random thing happens, a whole mess of them together will act like a gaussian. If you have a weighted die I won’t be able to tell you the probability of each individual number being rolled. But (given the mean and variance) if you roll a couple dozen weighted dice and add them up I can tell you (with fairly small error) the probability of any sum, and the more dice the smaller the error.
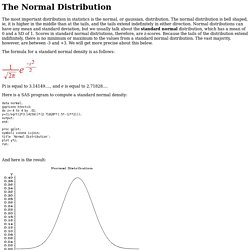
Systems with lots of pieces added together show up all the time in practice, so knowing your way around a gaussian is well worth the trouble. Gaussians also maximize entropy for a given energy (or other conserved quadratic quantity, energy is quadratic because ). From quantum mechanics, gaussians are the most “certain” wave functions. , where. Normal distribution - Reasons for data to be normally distributed. Non-normal Distributions Commonly Used in Health, Education, and Social Sciences: A Systematic Review. BBC Radio 4 - A Brief History of Mathematics, Carl Friedrich Gauss. Normal Distribution. History The normal curve was developed mathematically in 1733 by DeMoivre as an approximation to the binomial distribution.
His paper was not discovered until 1924 by Karl Pearson. Normal Distribution. A normal distribution is a very important statistical data distribution pattern occurring in many natural phenomena, such as height, blood pressure, lengths of objects produced by machines, etc.
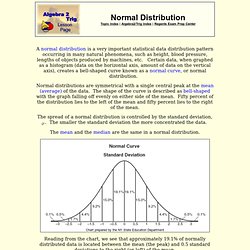
People.virginia.edu/~ent3c/psyc771/week2/class2/week2a.html. The most important distribution in statistics is the normal, or gaussian, distribution.
The normal distribution is bell shaped, ie, it is higher in the middle than at the tails, and the tails extend indefinitely in either direction. Normal distributions can have any mean and standard deviation, but we usually talk about the standard normal distribution, which has a mean of 0 and a SD of 1. Scores in standard normal distriutions, therefore, are z-scores. Means (All Steps) » Biostatistics » College of Public Health and Health Professions » University of Florida.
NOTE: Beginning on this page, the Learn By Doing and Did I Get This activities are presented as interactive PDF files.

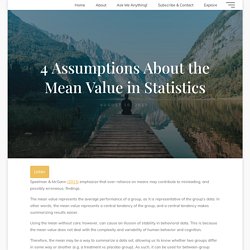
The interactivity may not work on mobile devices or with certain PDF viewers. Use an official ADOBE product such as ADOBE READER. If you have any issues with the Learn By Doing or Did I Get This interactive PDF files, you can view all of the questions and answers presented on this page in this document: How Mean is the Mean? 4 Assumptions About the Mean Value in Statistics – Reflectd. Speelman & McGann (2013) emphasize that over-reliance on means may contribute to misleading, and possibly erroneous, findings.
What is a Normal Distribution? My Chemical Romance - "I'm Not Okay (I Promise)" [Dialogue/MTV Version] Normal.pdf. History of normal distribution and how its extensive usage made economics/finance abnormal.. Andy Haldane once again. I mean how he keeps coming up with one terrific speech after the other. In his latest speech/paper Haldane looks at the history if normal distribution.
He goes into historical details of how the distribution came up, how and why it was given the name normal, how it moved from sciences to social sciences and finally into economics. And he links all this in a typical Haldane style connecting finance/economics to many things in nature. Just like other papers this one is so good that it is difficult to summarise the thoughts. Infact, there is very little in economics and finance that resembles normal distribution with thin tails.
For almost a century, the world of economics and finance has been dominated by randomness. But as Nassim Taleb reminded us, it is possible to be Fooled by Randomness (Taleb (2001)). Non-Normal Distributions in the Real World. By Thomas Pyzdek Introduction One day, early in my career in quality, I was approached by Wayne, a friend and the manager of the galvanizing plant.
"Tom" he began, "I have really been pushing quality in my area lately and everyone is involved. Non-Normal Distributions in the Real World. Stahl96.pdf. History of Normal Distribution. History of the Normal Distribution Author(s) David M. Lane Prerequisites Distributions, Central Tendency, Variability, Binomial Distribution. Gauss - 19th Century Mathematics. Carl Friedrich Gauss is sometimes referred to as the "Prince of Mathematicians" and the "greatest mathematician since antiquity". He has had a remarkable influence in many fields of mathematics and science and is ranked as one of history's most influential mathematicians. Gauss was a child prodigy. There are many anecdotes concerning his precocity as a child, and he made his first ground-breaking mathematical discoveries while still a teenager. At just three years old, he corrected an error in his father payroll calculations, and he was looking after his father’s accounts on a regular basis by the age of 5.
At the age of 7, he is reported to have amazed his teachers by summing the integers from 1 to 100 almost instantly (having quickly spotted that the sum was actually 50 pairs of numbers, with each pair summing to 101, total 5,050). Cc07s.pdf. Generalizedgamma.pdf. Introduction to Normal Distributions. Introduction to Normal Distributions Author(s) David M. Lane Prerequisites Distributions, Central Tendency, Variability Learning Objectives.
Areas under Normal Distribution. Standard Normal Distribution.