
Regression. Infer: An R package for tidy statistical inference. ANOVA. Survival Analysis. Forecasting. Bayesian. Machine Learning. Surveys. Teaching Stats. Epidemiology. Cross Validated. DrivenData. Randomise Me. Mirador. Mirador Mirador is a tool for visual exploration of complex datasets.
It enables users to discover correlation patterns and derive new hypotheses from the data. Download 1.3 (8 December 2014) Windows Mac OS X Instructions Download the file appropriate for your operating system. About Mirador is an open source project released under the GNU Public License v2. Further reading Ebola prognosis prediction—Computational methods for patient prognosis based on available clinical data—June 9th, 2015 Ebola data release—De-identified clinical data from Ebola patients treated at the Kenema Government Hospital in Sierra Leone between May and June of 2014—February 26th, 2015 Awards from the Department of Health and Human Services—Mirador received the third place, innovation and scientific excellence awards in the HHS VizRisk challenge—January 5th, 2015 Winning entries in the Mirador Data Competition—Read about the winning correlations submitted by Mirador users—December 1st, 2014.
Automatic Statistician. Apache Arrow. Apache Drill - Schema-free SQL for Hadoop, NoSQL and Cloud Storage. Datasharing. BigParser - Search across all your spreadsheets smartly via your mobile. Dataproofer: A proofreader for your data. Statcheck. Comma Chameleon. CSVshare. Data Trainer. It's no secret that the amount of data available in the world has exploded, with 90% of all available data throughout human history created in just the past few years.

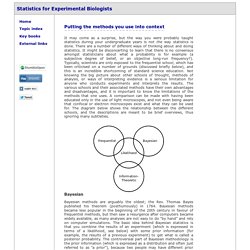
DrawMyData. E/R Assistant. Data Helpers. Understanding Patient Data. Sample Size Calculator. Overview of statistics. Putting the methods you use into context It may come as a surprise, but the way you were probably taught statistics during your undergraduate years is not the way statistics is done.
Glossary of statistical terms. A Taxonomy of Data Science. Posted: September 25th, 2010 | Author: Hilary Mason | Filed under: Philosophy of Data | Tags: data, data science, osemn, taxonomy | 31 Comments Both within the academy and within tech startups, we’ve been hearing some similar questions lately: Where can I find a good data scientist? What do I need to learn to become a data scientist? Or more succinctly: What is data science? We’ve variously heard it said that data science requires some command-line fu for data procurement and preprocessing, or that one needs to know some machine learning or stats, or that one should know how to `look at data’. All of these are partially true, so we thought it would be useful to propose one possible taxonomy — we call it the Snice* taxonomy — of what a data scientist does, in roughly chronological order: Obtain, Scrub, Explore, Model, and iNterpret (or, if you like, OSEMN, which rhymes with possum).
Demystifying data science terminology. The language used by data scientists can be confusing to anyone encountering it for the first time.
Ever changing best practices and constantly evolving technologies and methodologies have given rise to a range of nuanced terms used throughout casual data conversation. Unfamiliarity with these terms often leads to disconnected expectations across different parts of a business when undertaking projects involving data and analytics. To make the most out of any data science project, it is important that participants have a shared vocabulary and an understanding of key terms at a level that is required of their role. Mango Solutions is regularly involved in data science projects spanning different levels of a business. Below, we’ve outlined the most common data science terms that act as communication barriers in such projects: Click here to view the table as a PDF. What's the difference between data science, machine learning, and AI? When I introduce myself as a data scientist, I often get questions like “What’s the difference between that and machine learning?”
Or “Does that mean you work on artificial intelligence?” I’ve responded enough times that my answer easily qualifies for my “rule of three”: The fields do have a great deal of overlap, and there’s enough hype around each of them that the choice can feel like a matter of marketing. But they’re not interchangeable: most professionals in these fields have an intuitive understanding of how particular work could be classified as data science, machine learning, or artificial intelligence, even if it’s difficult to put into words. Timeline of Statistics. Data organization. My collaborators sometimes ask me, “In what form would you like the data?”
My response is always, “In its current form!” If the data need to be reformatted, it’s much better for me to write a script than for them to do a bunch of cut-and-paste. I’m a strong proponent of data analysts being able to handle any data files they might receive. But in many cases, I have to spend a lot of time writing scripts to rearrange the layout of the data.
And how would you like your data analysts to spend their time? Best Practices for Using Google Sheets in Your Data Project. A tweet by Hadley Wickham made me realize that we’ve learned quite a few good practices for using Google Sheets as part of our in-progress Provenance Index Remodel project at the Getty Research Institute.
Can you point me to any good papers or blog posts that document best practices for using google sheets when collecting data? — Hadley Wickham (@hadleywickham) March 26, 2018 This post is an attempt to sum up some lessons learned. A quick bit of context: while you can read more about the PIR project on the Getty website, from a technical standpoint what we’re doing is a very involved research database migration and enhancement project out of a legacy storage system into a modern graph database. Modes, Medians and Means: A Unifying Perspective. Introduction / Warning Any traditional introductory statistics course will teach students the definitions of modes, medians and means.
But, because introductory courses can’t assume that students have much mathematical maturity, the close relationship between these three summary statistics can’t be made clear. This post tries to remedy that situation by making it clear that all three concepts arise as specific parameterizations of a more general problem. To do so, I’ll need to introduce one non-standard definition that may trouble some readers. In order to simplify my exposition, let’s all agree to assume that 0^0 = 0. Sufficient statistics misunderstandings. Experience with the normal distribution makes people think all distributions have (useful) sufficient statistics [1].
If you have data from a normal distribution, then the sufficient statistics are the sample mean and sample variance. These statistics are “sufficient” in that the entire data set isn’t any more informative than those two statistics. They effectively condense the data for you. (This is conditional on knowing the data come from a normal. More on that shortly.) Absolute Deviation Around the Median. Median Absolute Deviation (MAD) or Absolute Deviation Around the Median as stated in the title, is a robust measure of central tendency.
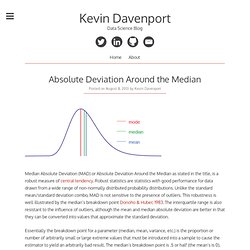
Robust statistics are statistics with good performance for data drawn from a wide range of non-normally distributed probability distributions. Unlike the standard mean/standard deviation combo, MAD is not sensitive to the presence of outliers. This robustness is well illustrated by the median’s breakdown point Donoho & Huber, 1983. Taleb - Deviation. The notion of standard deviation has confused hordes of scientists; it is time to retire it from common use and replace it with the more effective one of mean deviation. Standard deviation, STD, should be left to mathematicians, physicists and mathematical statisticians deriving limit theorems. There is no scientific reason to use it in statistical investigations in the age of the computer, as it does more harm than good—particularly with the growing class of people in social science mechanistically applying statistical tools to scientific problems.
Say someone just asked you to measure the "average daily variations" for the temperature of your town (or for the stock price of a company, or the blood pressure of your uncle) over the past five days. The five changes are: (-23, 7, -3, 20, -1). Use standard deviation (not mad about MAD) Nassim Nicholas Taleb recently wrote an article advocating the abandonment of the use of standard deviation and advocating the use of mean absolute deviation. Mean absolute deviation is indeed an interesting and useful measure- but there is a reason that standard deviation is important even if you do not like it: it prefers models that get totals and averages correct. Absolute deviation measures do not prefer such models. So while MAD may be great for reporting, it can be a problem when used to optimize models. Let’s suppose we have 2 boxes of 10 lottery tickets: all tickets were purchased for $1 each for the same game in an identical fashion at the same time.
For our highfalutin data science project let’s look at the payoffs on the tickets in the first box and try to build a best predictive model for the tickets in the second box (without looking at the payoffs in the second box). Scoring Multiple Variables, Too Many Variables and Too Few Observations: Data Reduction. This post will grow to cover questions about data reduction methods, also known as unsupervised learning methods. These are intended primarily for two purposes: collapsing correlated variables into an overall score so that one does not have to disentangle correlated effects, which is a difficult statistical taskreducing the effective number of variables to use in a regression or other predictive model, so that fewer parameters need to be estimated The latter example is the "too many variables too few subjects" problem.
Standard deviation vs Standard error. I got often asked (i.e. more than two times) by colleagues if they should plot/use the standard deviation or the standard error, here is a small post trying to clarify the meaning of these two metrics and when to use them with some R code example. Standard deviation Standard deviation is a measure of dispersion of the data from the mean. set.seed(20151204) #generate some random data x<-rnorm(10) #compute the standard deviation sd(x) 1.144105 For normally distributed data the standard deviation has some extra information, namely the 68-95-99.7 rule which tells us the percentage of data lying within 1, 2 or 3 standard deviation from the mean.
Here is the plot we made: Standard Error. Understanding the Sampling Distribution. Among the many contenders for Dr Nic’s confusing terminology award is the term “Sampling distribution.” One problem is that it is introduced around the same time as population, distribution, sample and the normal distribution. The Central Limit Theorem – with Dragons. To quote Willy Wonka, “A little magic now and then is relished by the best of men [and women].”
Permutations and Combinations with base R. The area of combinatorics, the art of systematic counting, is dreaded territory for many people, so let us bring some light into the matter: in this post we will explain the difference between permutations and combinations, with and without repetitions, will calculate the number of possibilities and present efficient R code to enumerate all of them, so read on… The cases we cover in this post: Communicating quality, uncertainty and change – GSS. This document has replaced:Communicating uncertainty and change. Confidence and Prediction Intervals. Difference between prediction intervals and confidence intervals. Prediction intervals and confidence intervals are not the same thing. Unfortunately the terms are often confused, and I am often frequently correcting the error in students’ papers and articles I am reviewing or editing.
A prediction interval is an interval associated with a random variable yet to be observed, with a specified probability of the random variable lying within the interval. How do you think about the values in a confidence interval? Philip Jones writes: As an interested reader of your blog, I wondered if you might consider a blog entry sometime on the following question I posed on CrossValidated (StackExchange).I originally posed the question based on my uncertainty about 95% CIs: “Are all values within the 95% CI equally likely (probable), or are the values at the “tails” of the 95% CI less likely than those in the middle of the CI closer to the point estimate?” I posed this question based on discordant information I found at a couple of different web sources (I posted these sources in the body of the question).I received some interesting replies, and the replies were not unanimous, in fact there is some serious disagreement there!
After seeing this disagreement, I naturally thought of you, and whether you might be able to clear this up.Please note I am not referring to credible intervals, but rather to the common medical journal reporting standard of confidence intervals. When Discussing Confidence Level With Others… Cls: informal, traditional, bootstrap. Confidence intervals are needed because there is variation in the world. Nearly all natural, human or technological processes result in outputs which vary to a greater or lesser extent. Sig P-Vals and Overlapping CIs. 02. Binomial CIs. CIs for the Risk Ratio (Relative Risk)
Purrr-ing through bootstrap CIs. Cosines and correlation. Degrees of Freedom Tutorial. Transforming data with zeros. Log Transformations for Skewed and Wide Distributions. Don't do the Wilcoxon. Four types of errors. 7 ways to separate errors from statistics. Exploring the chi-square test through simulation - part 2. Ordinal Chi-Square. Chart of distribution relationships. Univariate Distribution Relationship Chart. Distribution Families. What distribution does my data have? Truncated Poisson distributions in R and Stan. Same Stats, Different Graphs: Generating Datasets with Varied Appearance and Identical Statistics through Simulated Annealing. Prob and Stats Cookbook. Probability Cheatsheet.
QQ plots. QQ Plots for NYs Ozone Pollution Data. Kernel Density Estimation. Value of re-analysis. Multiple testing. Cross-Validation: Why every statistician should know. AIC & BIC vs. Crossvalidation. How do I interpret the AIC? Instrumental Variables. Understanding Instrumental Variables. Data Meta-Metrics. Calculating statistical power. When anyone claims 80% power, I'm skeptical. Amnesia — data anonymization made easy. To Reduce Privacy Risks, the Census Plans to Report Less Accurate Data. Suppressed data (left-censored counts) A more systematic look at suppressed data. Hashing PII does not protect privacy. Play with the cyphr package. Encryptr: easily encrypt and decrypt columns of sensitive data. I Visited 47 Sites. Hundreds of Trackers Followed Me. Synthpop: Generating Synthetic Data Sets in R.
Synthesising Multiple Linked Data Sets and Sequences in R.