
ASP.NET MVC 3. How to: Attach and Detach the Profiler to Running Processes. The profiler can be used to attach to or detach from a running process to make sampling and gathering performance data easier.
You can use this method to profile a process when you want to avoid gathering data about application load time, or to monitor the performance of a process after it reaches a specific state. The processes that are available to profile depend on the User Access Permissions that are set by an administrator of the computer. A User account may, for example, have permission for any of the following: Advanced profiling features, when the administrator has set the driver and service to start.
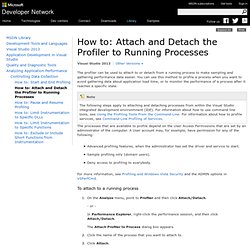
Sample profiling only (domain users). For more information, see Profiling and Windows Vista Security and the ADMIN options in VSPerfCmd. To attach to a running process On the Analyze menu, point to Profiler and then click Attach/Detach. - or - In Performance Explorer, right-click the performance session, and then click Attach/Detach. How to: Profile a Web Site or Web Application Using the Performance Wizard. You can use the Performance Wizard to collect performance data for an ASP.NET Web application.
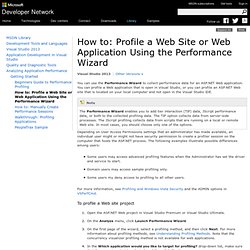
You can profile a Web application that is open in Visual Studio, or you can profile an ASP.NET Web site that is located on your local computer and not open in the Visual Studio IDE. Depending on User Access Permissions settings that an administrator has made available, an individual user might or might not have security permission to create a profiler session on the computer that hosts the ASP.NET process. The following examples illustrate possible differences among users: Some users may access advanced profiling features when the Administrator has set the driver and service to start. Domain users may access sample profiling only. For more information, see Profiling and Windows Vista Security and the ADMIN options in VSPerfCmd. How to: Upgrade a Visual Studio 2010 Start Page. Troubleshooting Profiling Tools Issues. After you profile an application, a profiling data (.vsp) file is not created and you receive the following warning in the Output window or in the command window: PRF0025: No data was collected.

This problem can be caused by several issues: A process that was profiled by using the sampling or the .NET memory method starts a child process that becomes the process that performs the application work. For example, some applications read the command line to determine whether they were started as a Windows application or as a command-line application. If a Windows application was requested, the original process starts a new process configured as a Windows application and then the original process exits. After you profile an application, you see numbers instead of function names in reports and views. Visual Studio 2012 Compatibility. Some solutions, projects, files, and other assets that you created in Visual Studio 2010 Service Pack 1 (SP1) will run without modification in Visual Studio 2012, but others have to be upgraded.
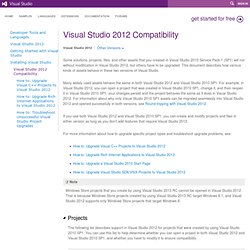
This document describes how various kinds of assets behave in these two versions of Visual Studio. Many widely used assets behave the same in both Visual Studio 2012 and Visual Studio 2010 SP1. Visual Studio Tools for Git extension. Sign in to write a review Sort by: Not a patch on using git in the command line.
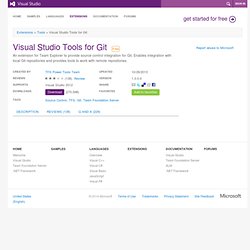
We've had plenty of issues around using this plugin and there are still some bugs and missing essential features. I'll outline some of them that most effect me. * No stashing* No way to fetch and track new remote branches. We have also in the past had issues where it would remove entire projects from the index, sending the team into a panic. Some of my teammates like the VS integration, which itself is alright, but it needs to be a lot better if I'm going to trust it enough to leave the command line. Much needed tool. For example: Try getting the History of a file. It would be great to have an annotation feature available! Could you support Visual Studio 2010? Thank you, very very much! "I second the motion" by Julien Roncaglia, (November 28 2013) Missing features that needs to be at the top of the list of "coming soon", in my order of preference, more "!
" !!!!! !!!! !! Xcopy Command Details and Examples. What is the Xcopy Command?
The xcopy command is a Command Prompt command used to copy one or more files and/or folders from one location to another location. The xcopy command is also a DOS command available in MS-DOS. The xcopy command, with its many options and ability to copy entire directories, is similar to, but much more powerful than, the traditional copy command. Discovering Code: Updating a Visual Studio 2010 Extension for Visual Studio 2012. UPDATE - 16 January 2013 The contents of this article have been updated to correct a problem that existed at the time of publication.
In addition, I have uploaded this updated Visual Studio extension to the Visual Studio Gallery. Hello everyone. It's been way too long. It seems I'm always doing this and that and never have time to write down anything, anywhere—whether that be on this blog, or on Facebook. In order to update the extension, you will need access to the extension's source code; so these instructions will have limited impact for most of you out there unless you can get your hands on the source code for that favorite extension. Fortunately for me, the author of my favorite extension, AllMargins, did post his source code, especially since this extension is no longer available from the Visual Studio Gallery.