
Dashboards by Keen IO. 30 Simple Tools For Data Visualization. There have never been more technologies available to collect, examine, and render data.
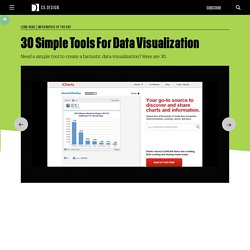
Here are 30 different notable pieces of data visualization software good for any designer's repertoire. They're not just powerful; they're easy to use. In fact, most of these tools feature simple, point-and-click interfaces, and don’t require that you possess any particular coding knowledge or invest in any significant training. Let the software do the hard work for you. Your client will never know.
100 Tools. Chart selection 1.
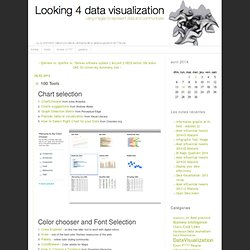
ChartChooser from Juice Analytics2. Charts suggestions from Andrew Abela3. Graph Selection Matrix from Perceptual Edge4. Periodic table of visualization from Visual Literacy. Shiny. Top 50+ Tools for Creating Infographics. Telling your story in visual form through the use of infographics has been one of the hottest trends in recent times.

Given the tremendous information available online, people are now more interested to get information through colorful and interesting graphics, instead of words and numbers. Creating infographics, however, requires tremendous analytical and creative skills plus the ability to convert these data and information into interesting visuals. The good news is, there are available resources online that you can use to help you create infographics. In this post, we will list down all available resources and tools that you can use to simplify the process of creating infographics. If you want to view some excellent examples of a well-designed infographics, then checkout our previous post on the following topics:
Simple Line Chart. Bost.ocks.org/mike/d3/workshop/ Data Visualizations, Challenges, Community. AmCharts - JavaScript Chart Library. Dc.js - Dimensional Charting Javascript Library. Dc.js - Dimensional Charting Javascript Library dc.js is a javascript charting library with native crossfilter support, allowing highly efficient exploration on large multi-dimensional datasets (inspired by crossfilter's demo).

It leverages d3 to render charts in CSS-friendly SVG format. Charts rendered using dc.js are data driven and reactive and therefore provide instant feedback to user interaction. dc.js is an easy yet powerful javascript library for data visualization and analysis in the browser and on mobile devices. Version Status. D3 Tutorial: An SVG primer. Last updated 2012 December 30 D3 is most useful when used to generate and manipulate visuals as SVGs.
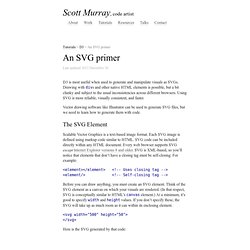
Drawing with divs and other native HTML elements is possible, but a bit clunky and subject to the usual inconsistencies across different browsers. Using SVG is more reliable, visually consistent, and faster. Vector drawing software like Illustrator can be used to generate SVG files, but we need to learn how to generate them with code. The SVG Element Scalable Vector Graphics is a text-based image format. Before you can draw anything, you must create an SVG element. Here is the SVG generated by that code: Don’t see it? Note that there is an svg element (yay!) Also note that the browser assumed pixels as the default measurement units. Simple Shapes There are a number of visual elements that you can include between those svg tags, including rect, circle, ellipse, line, text, and path. rect draws a rectangle. 20 Fresh JavaScript Data Visualization Libraries. There are plenty of JavaScript libraries out there for rendering your otherwise plain and boring numerical data into beautiful, interactive, and informative visualizations.

The beauty of using JavaScript for data visualization is that, if created correctly, your data will be highly accessible (usually via HTML tables). A long time ago (2008), I wrote about JavaScript solutions for graphing and charting data and this article revisits the topic with twenty more JavaScript libraries that you can use to bring your data to life. 1. Highcharts Highcharts is one of the most promising JavaScript charting libraries to hit the scene recently, with its large array of features including seven charting types (line, pie, and bar among them), the ability to zoom in and out of charts, and tooltips for offering more information about data points. 2. gRaphaël gRaphaël is a charting library based on Raphaël, a vector graphics drawing JavaScript library.
Data visualization. JS DataVis. Javascript Charting. GraphUp · jQuery Plugin. GraphUp is flexible jQuery plugin that allows you to spice up your plain data tables in a snap.
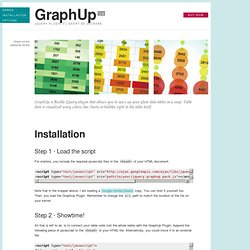
Table data is visualized using colors, bar charts or bubbles right in the table itself. Installation Step 1 · Load the script For starters, you include the required javascript files in the <head> of your HTML document. Note that in the snippet above, I am loading a Google hosted jQuery copy. Step 2 · Showtime! All that is left to do, is to connect your table cells (not the whole table) with the GraphUp Plugin.
Have a look at the demos to see some real code in action. Options Options listed in alphabetical order Global defaults You can easily change the default values for the options listed above. Custom cleaners. GraphUp Demo 1. GraphUp Demo 2. GraphUp Demo 3.