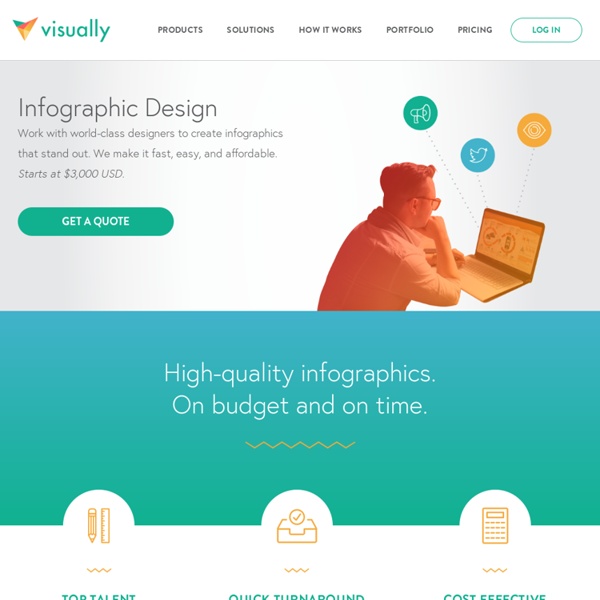


http://visual.ly/product/infographic-design
40 Useful and Creative Infographics Six Revisions Menu Main Categories CSS HTML JavaScript Web Design WordPress Web Development Design Inspiration UX Design UI Design Freebies Tutorials Tools Online Master of Arts in History As part of its flagship history program, the University offers its Master of Arts in History online degree. This popular graduate history degree takes students on an academic journey exploring the key historic events, people, and cultures that fundamentally shaped the world today. Through research, discussion, and analysis, students also attain a knowledgeable perspective of how future societies and nations might progress. History graduate students are offered the flexibility of choosing from some of the most favored eras including American, Ancient and Classical, European, Global, and Public History. The University’s faculty is comprised of scholar-practitioners.
How To Create Outstanding Modern Infographics In this tutorial you will learn that data doesn't have to be boring, it can be beautiful! Learn how to use various graph tools, illustration techniques and typography to make an accurate and inspiring infographic in Adobe Illustrator. Start by using the Rectangle Tool (M) to draw a shape. Give it a subtle radial gradient too. The entire design is based on a grid of four columns. To make the columns first select the rectangle and drag a guide onto the centre of the shape.
jQuery Plugins for Fluid Layouts/Responsive Web Design As we all know by now, when designing responsive websites, all design components will need to adapt to the device (from mobile browsers to netbooks and tablets) on which they are displayed and have to interact with. Serving a website to different devices can be done with the help of jQuery plugins. Last week I showed you some free and high quality responsive jQuery Slide and Gallery Plugins here on the gonzoblog. This week I’ld love to present you some free jQuery Plugins to dynamically arrange code blocks based on breakpoints, create responsive navigation menus and to resize your (background) images, text or videos. Actually these jQuery plugins are created for web designers and developers to add amazing effects and (extra) functionality to websites and/or apps.
Intersect this! “Intersection” The Intersection design is a Venn diagram with two overlapping circles - you control what is in the circles and (just as importantly) what lies between. If you have trouble on an older computer, try using an alternative version. This is a 400x300 design, with 800x600 available to subscribers. There are related designs available. 50 Great Examples of Data Visualization Wrapping your brain around data online can be challenging, especially when dealing with huge volumes of information. And trying to find related content can also be difficult, depending on what data you’re looking for. But data visualizations can make all of that much easier, allowing you to see the concepts that you’re learning about in a more interesting, and often more useful manner. Below are 50 of the best data visualizations and tools for creating your own visualizations out there, covering everything from Digg activity to network connectivity to what’s currently happening on Twitter. Music, Movies and Other Media
Meetings: Web Conferencing with high-definition video Once you're all in the meeting, share easily and work together effectively. Show others anything on your computer – files, apps, your whole desktop. Then pass the ball to someone else who'd like to share. Work on a file together or brainstorm on the whiteboard. And record every ah-ha! Applying Mathematics To Web Design - Smashing Magazine Advertisement “Mathematics is beautiful.” This may sound absurd to people who wince at numbers and equations. But some of the most beautiful things in nature and our universe exhibit mathematical properties, from the smallest seashell to the biggest whirlpool galaxies.
Newsletter Design: 50+ Great Examples A good newsletter campaign can be a great way to inform your subscribers of all your company’s latest news, products and specials. In this post you will see some great examples of newsletter designs from various online companies. If you’re in need of some design inspiration, this post just might do the job. Want more articles on Email Newsletter Design ? Check out some of my previous posts: The Anatomy Of An Infographic: 5 Steps To Create A Powerful Visual Information is very powerful but for the most bit it is bland and unimaginative. Infographics channel information in a visually pleasing, instantly understandable manner, making it not only powerful, but extremely beautiful. Once used predominantly to make maps more approachable, scientific charts less daunting and as key learning tools for children, inforgraphics have now permeated all aspects of the modern world. I designed a couple of infographics back in college, the need arising especially around the time Soccer World Cup fever spiked. It was a fun process representing the different groups, predicting winners in each group at each stage and creating a mock pairing of teams that would clash all the way leading upto the finals. I was a devout Argentinian supporter at the time.