
VoiceMap - Transform voice into images. Sketcho Frenzy - Home. Infographics en datavisualisatie in woord en beeld. Infographics zijn tegenwoordig ontzettend populair op internet.
Iedere gebeurtenis, film en populair product heeft wel een eigen infographic. Maar wat is een infographic eigenlijk? In dit artikel een overzicht van alles wat ik heb gevonden. Een ode in woord en beeld aan een fantastische designdiscipline, die met recht erg populair is. Het ontstaan van infographics Veel van de weergaven die men online publiceert onder de naam ‘infographic’ zou ik echter niet direct een infographic noemen. Van oudsher heeft Wired en in Nederland het Algemeen Dagblad een goede naam als het gaat om infographics. Waren het niet al monniken die in de twaalfde eeuw hun boeken en wetenschappelijk werk illustreerden met grafische infogrammen (bijv. Hedendaagse infographics Tegenwoordig wordt steeds meer visueel weergegeven, dus ook data.
Beeld & impact, storytelling & fantasie. Fast Analytics and Rapid-fire Business Intelligence from Tableau Software. Been to a meeting in Atlanta with graphic facilitation or visual mapping? How to use visuals for creativity, innovation, personal, professional and organizational development. A visual exploration on mapping complex networks. Bestiario. Visual Thinking.
SketchHatch.
Visual storytelling. Loosetooth.com = Brandy Agerbeck = graphic facilitator + artist. Graphic facilitation, graphic recording, visual facilitation, scribing, drawing, printmaking, sewing, quilting, crafting. IFVP Community. Datavisualisatie. International visual practitioners. An Innovative Way to Engage. The term graphic recording may mean many different things to many people, but the root of the definition is quite simple.
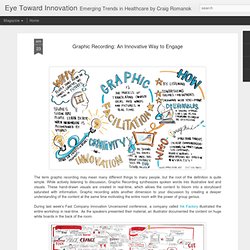
While actively listening to discussion, Graphic Recording synthesizes spoken words into illustrative text and visuals. These hand-drawn visuals are created in real-time, which allows the content to bloom into a storyboard saturated with information. Graphic recording adds another dimension to your discussion by creating a deeper understanding of the content at the same time motivating the entire room with the power of group genius. During last week's Fast Company Innovation Uncensored conference, a company called Ink Factory illustrated the entire workshop in real-time. As the speakers presented their material, an illustrator documented the content on huge white boards in the back of the room.
During SXSW 2012, a film, interactive, and music festival and conference, Ogilvy Notes sponsored a company called ImageThink to illustrate all of the presentations. Loading. VISUAL STRATEGY. A Periodic Table of Visualization Methods. All you need to know about Visual Thinking. Snel visualiseren van strategie, concept en ontwerp. Het is niets nieuws onder de zon: visualiseren helpt.
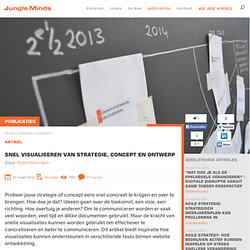
Hoeveel helpt het? Bij het zien en horen van informatie blijft er 65% hangen tegenover 10% bij het alleen horen bij een verhaal (zie afbeelding). Daarnaast blijkt dat 83% van het leerproces van de mens visueel gaat (smartdraw). Kracht van de schets Bij het maken van een visualisatie kan bestaand beeldmateriaal gebruikt worden: foto’s, afbeeldingen, collages.
De schetsstijl geeft een persoonlijk, op maat gemaakt beeld. Hoe kan deze snelle schetsmethode worden toegepast binnen de website ontwikkeling? Het vormen en communiceren van internetstrategieHet definiëren van een ontwerprichtingHet uitleggen van een concept Voorbeelden laten zien hoe er invulling gegeven kan worden aan deze fases: Visualiseren van strategie Ontwerpbureau’s springen graag in op de kans om hun visualisatie skills toe te passen op de strategische vraagstukken. Ook grafische bureau’s kunnen interessant zijn: Imagethink.net is hiervan een voorbeeld. Tot slot.
Graphic Facilitation, Visual Recording. Home. The top 10 visual thinkers on Twitter. Visual thinking is an essential executive skill today.
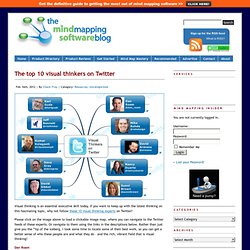
If you want to keep up with the latest thinking on this fascinating topic, why not follow these 10 visual thinking experts on Twitter? Please click on the image above to load a clickable image map, where you can navigate to the Twitter feeds of these experts. Or navigate to them using the links in the descriptions below. Rather than just give you the “tip of the iceberg, I took some time to locate some of their best work, so you can get a better sense of who these people are and what they do – and the rich, vibrant field that is visual thinking!
Dan Roam@dan_roam Author of the best-selling books The Back of the Napkin and Blah Blah Blah and frequent public speaker, Dan has done a lot to bring visual thinking to the attention of executives and leaders, and has created a simple framework to begin using it. Mike Rohde@rohdesign David Armano@armano Nancy Duarte@nancyduarte Sunni Brown@sunnibrown David Sibbet@davidsibbet Dave Gray(@davegray. Jennwicks. Company Netherlands. Napkin Academy. If you have a coupon code, please enter it on the payment page.
Note: If selecting PayPal as a payment option, be aware that some users have experienced a delay in processing. Please wait until the payment receipt arrives before attempting to access the site.Thank you – we appreciate your patience! Visual thinking for the business world.
Visual Harvesting graphic facilitation graphic recording. Visueel faciliteren: Wat ik NU zeg komt NU in beeld. Doodle Revolution. Bigger Picture. Graphic Facilitation A blog by Stine Arensbach.