
MetaCarto » La Facilitation Graphique à Sestri. Roberta Faulhaber et Catherine Tanitte, toutes deux vice-présidentes de Metacarto, ont eu le plaisir de collaborer avec Créaconférence à Sestri en Avril 2013 en présentant un focus session d’un jour sur la facilitation graphique appliqué la method “Creative Problem Solving” ou CPS.
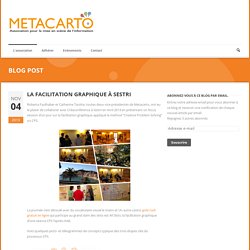
La journée s’est déroulé avec du vocabulaire visuel le matin et Un autre casino gold rush gratuit en ligne qui participe au grand slam des slots est All Slots. la facilitation graphique d’une séance CPS l’après-midi. Voici quelques picto- et idéogrammes de concepts typique des trois étapes clés du processus CPS. An Insider’s Guide to Graphic Facilitation. Book Review: The Graphic Facilitator’s Guide: How to use your listening, thinking and drawing skills to make meaning.
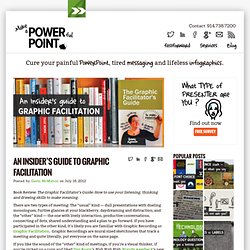
There are two types of meeting: The “usual” kind — dull presentations with dueling monologues, furtive glances at your blackberry, daydreaming and distraction; and the “other” kind — the one with lively interaction, productive conversations, connecting of dots, shared understanding and a plan to go forward. If you have participated in the other kind, it’s likely you are familiar with Graphic Recording or Graphic Facilitation. Graphic Recordings are mural sized sketchnotes that track a meeting and quite literally, put everyone on the same page. If you like the sound of the “other” kind of meetings, if you’re a visual thinker, if you’ve picked up a copy and liked Dan Roam‘s Blah Blah Blah; Brandy Agerbeck‘s new book is for you. The Graphic Facilitator’s Guide: How to use your listening, thinking and drawing skills to make meaning.
The Guide is chock full of useful tips. Resources for Graphic Recording >> Jeannel King, Graphic Recording and Visual Meeting FacilitationJeannel King – Big Picture Solutions. From pens and paper, to software and hardware, these graphic recording tools can get you started. Want to pick up the pen, but you’re not that confident? Here’s a great book to bolster your confidence (because you can totally DO it!)
: Beyond Words: A Guide to Drawing Out Ideas , by Milly Sonneman. GFGuide_Powers_Agerbeck. 20 powerful business uses of graphic recording and facilitation. Graphic facilitation — drawing out a challenge, situation or process on a whiteboard with simple shapes — is a powerful tool to help teams gain clarity, make better decisions and take productive action on challenges and opportunities.
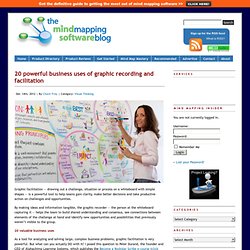
By making ideas and information tangible, the graphic recorder — the person at the whiteboard capturing it — helps the team to build shared understanding and consensus, see connections between elements of the challenge at hand and identify new opportunities and possibilities that previously weren’t visible to the group. 20 valuable business uses As a tool for analyzing and solving large, complex business problems, graphic facilitation is very powerful. But what can you actually DO with it? I posed this question to Peter Durand, the founder and CEO of Alphachimp Learning Systems, which publishes the Become a Rockstar Scribe e-course (click here to read my review of it). Deadline for discount extended one week Read my review of Become a Rockstar Scribe first. Resources for organizers. The Difference: Sketch Notes, Graphic Recording and Graphic Facilitation-Jeannel King - Big Picture SolutionsJeannel King – Big Picture Solutions.
Learning the Lingo As visual practices such as sketch noting, graphic recording, and graphic facilitation become more…well, visible to the public, so does the confusion around the terms we visual practitioners use to describe our work. This confusion is understandable. Heck, folks in the industry don’t always use these terms consistently! Training Courses. 2013 Course Schedule March 14-15: Strategic Illustration Course 101 - Lausanne, Switzerland Course Registration Our classes teach all kinds of people the skills they need to harness the power of Strategic Illustration TM & Graphic Facilitation– a potent tool that enables groups of people to work together and problem solve in highly effective, collaborative and sustainable ways.
Visual Innovation Accelerator Toolbook. Download it Now: Download the Toolbook by sharing spreading the word about it!
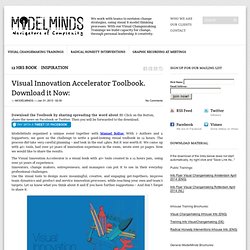
Click on the Button, share the news on Facebook or Twitter. Then you will be forwarded to the download. ModelMinds organized a unique event together with Manuel Bollue: With 7 Authors and 2 Supporters, we gave us the challenge to write a good-looking visual toolbook in 12 hours. The process did take very careful planning – and took in the end 14hrs. But it was worth it: We came up with 40+ tools, had over 50 years of innovation experience in the room, wrote over 50 pages. The Visual Innovation Accelerator is a visual book with 40+ tools created in a 12 hours jam, using over 50 years of experience. IFVP Community.
Scribing 101. La facilitation graphique et le design de l'information. La facilitation graphique et le design de l'information. Comment utiliser les couleurs dans le Webdesign. Qu'est-ce la facilitation graphique? - Roberta Faulhaber, facilitation graphique. Définition de la Facilitation Graphique. Objectifs Comme son nom l’indique, cette pratique cherche à faciliter l’appréhension de sujets complexes par leur nature ou par la forme qu’ils prennent habituellement en proposant une visualisation adaptée.
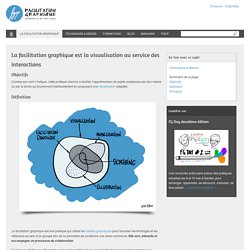
Définition La facilitation graphique est une pratique qui utilise les médias graphiques pour favoriser les échanges et les réflexions au sein d’un groupe afin de lui permettre de construire une vision commune. Looking 4 data visualization: 8 notes en février 2012. Chart selection 1.
ChartChooser from Juice Analytics2. Charts suggestions from Andrew Abela3. Graph Selection Matrix from Perceptual Edge4. The Visualizing Player on Datavisualization. Yesterday Visualizing.org launched version 1.0 of their Visualizing Player, a media player designed specifically for embedding and displaying infographics and data visualizations.
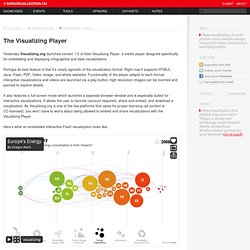
Perhaps its best feature is that it’s nearly agnostic of the visualization format. Right now it supports HTML5, Java, Flash, PDF, Video, Image, and whole websites. Functionality of the player adapts to each format; interactive visualizations and videos are launched via a play button, high resolution images can be zoomed and panned to explore details. It also features a full-screen mode which launches a seperate browser window and is especially suited for interactive visualizations. It allows the user to favorite (account required), share and embed, and download a visualization. Facilitation Tools - Workshop Materials - Neuland: Products for active learning.
Anders Sandberg : Concevoir des superintelligences collectives. Par Rémi Sussan le 18/06/10 | 6 commentaires | 3,420 lectures | Impression.
Les clefs de la facilitation graphique - Accueil. Manager-Facilitateur.