
Coronavirus (COVID-19) Loading Skip to main content Site Menu.

Domů - Ochranné roušky. When and how to use masks. Géodes - Santé publique France. COVID-19 Corona Tracker. Onemocnění aktuálně od MZČR. Coronavirus COVID-19 (2019-nCoV) Lancet Inf Dis Article: Here. Mobile Version: Here. Data sources: Full list. Downloadable database: GitHub, Feature Layer. Lead by JHU CSSE. Technical Support: Esri Living Atlas team and JHU APL. Cases and Death counts include confirmed and probable (where reported).Recovered cases are estimates based on local media reports, and state and local reporting when available, and therefore may be substantially lower than the true number. PPE Products. COVID-19 tracker. Coronavirus Disease 2019 (COVID-19) What the coronavirus lockdown looks like from space. More than a third of the world's population is now under lockdown as an increasing number of countries implement sweeping measures to fight the coronavirus pandemic.

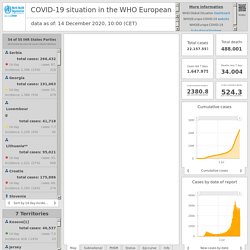
The drastic measures have emptied streets, disrupted travel and slowed economic activity - all while slashing air pollution. Coronavirus data reveals how COVID-19 is spreading in Australia. Coronavirus maps and charts: A visual guide to the outbreak. EURO_COVID19_Dashboard - PUBLIC. Figures, colors and icons in country and territory lists Case totals include both probable and confirmed cases reported to WHO. 14-day incidence values represent incidence (# new cases reported) per 100 000 population over the past 14 days.
COVID-19 #CoronaVirus Infographic Datapack. COVID-19 #Coronavirus latest data visualized IMPORTANT READS » Flattening the Curve (NY Times) » Detailed #coronavirus pandemic overview + modelling (Medium) » How does Corona virus compare with flu?

(NY Times) » Coronavirus is very different to Spanish flu (NY Times) Change log UPDATE 12th Mar – added Flattening the Curve UPDATE 11th Mar – revised Case Fatality Rates by Country. Italy up to 6.2%. Updated Recovery rates: 56.6% recovered drops to 55%. Coronavirus: Travel restrictions, border shutdowns by country. What Is Coronavirus: Mapping the Pneumonia-Like Respiratory Illness in China, Globally. Effectiveness of airport screening at detecting travellers infected with novel coronavirus COVID-19 (formerly 2019-nCoV) Event Horizon - COVID-19. => numbers last updated: Sat, 28 Mar 2020 21:11:04 CET <= As of March 28, 2020 , 593291 total cases of COVID-19 have been confirmed worldwide.

Background The current outbreak of the COVID-19 virus started in Wuhan City, Hubei Province, China. While the first cases were reported as early as December 8, 2019, the outbreak gained global attention on December 31, 2019, when the World Health Organization (WHO) was alerted to “several cases of pneumonia” by an unknown virus. ABC coronavirus data charts COVID-19 spread in Australia. Tracking Africa's coronavirus cases.
COVID-19: This tool tracks coronavirus's path in Europe. While some European countries are easing restrictions, others remain under lockdown.
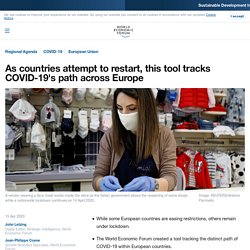
The World Economic Forum created a tool tracking the distinct path of COVID-19 within European countries. Europe is starting down an uneven road to recovery. Denmark is reopening society more quickly than anticipated, and Switzerland is eyeing the easing of emergency measures. At the same time, France has extended its lockdown period and the UK has said its restrictions will remain in place for the foreseeable future – as those countries continue to suffer dearly from the fallout of COVID-19. The background for this disparity has been disagreement over matters including whether to jointly issue debt to fund Europe’s collective rehabilitation. Europe’s patchy attempted return to normalcy might make retracing the coronavirus’s path across individual countries in the region instructive.
Spain has also seen a sharp disparity among regions in terms of confirmed cases. Reported CoViD-19 Cases in India by Districts. Coronavirus: April 15 day 2271 Americans will die from infection. There are dire warnings the United States will face its worst death toll in the second week of April.

New modelling predicts 2271 people will die from coronavirus on April 15 alone. The analysis was done by the University of Washington School of Medicine and predicted deaths per day will only drop to under 100 after June 9. “Our estimated trajectory of COVID-19 deaths assumes continued and uninterrupted vigilance by the general public, hospital and health workers, and government agencies,” Dr Christopher Murray said.
“The trajectory of the pandemic will change – and dramatically for the worse – if people ease up on social distancing or relax with other precautions. We encourage everyone to adhere to those precautions to help save lives. “We hope these forecasts will help leaders of medical systems figure out innovative ways to deliver high-quality care to those who will need their services in the coming weeks.” The US has the most cases of anywhere in the world, ahead of Italy with 101,739. Private Kit: Safe Paths; Privacy-by-Design Covid19 Solutions using GPS+Bluetooth for Citizens and Public Health Officials. MoHFW.
COVID‑19 - Mobility Trends Reports. COVID-19 tracker. How coronavirus spread across the globe - visualised. Since New Year’s Eve the world has lived through 100 days of Covid-19.
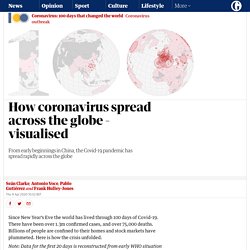
There have been over 1.3m confirmed cases, and over 75,000 deaths. Billions of people are confined to their homes and stock markets have plummeted. Here is how the crisis unfolded. Note: Data for the first 20 days is reconstructed from early WHO situation reports and the later progress of the disease. The case counts for the remaining days comes from the open source Johns Hopkins data repository. What about the next 100 days? There are some tentative indications that “the curve is flattening” in Italy and Spain, as the number of new cases each day falls. Coronavirus Update (Live): 3,567,005 Cases and 248,313 Deaths from COVID-19 Virus Pandemic - Worldometer. How dangerous is the virus? There are three parameters to understand in order to assess the magnitude of the risk posed by this novel coronavirus: TrackCorona - COVID-19 Tracker and Live Map. Number of coronavirus (COVID-19) cases and risk in the UK. Video: How to wash your hands properly Number of cases and deaths As of 9am on 27 April, there have been 719,910 tests, with 37,024 tests on 26 April. 569,768 people have been tested, of whom 157,149 have tested positive.

As of 5pm on 26 April, of those hospitalised in the UK who tested positive for coronavirus, 21,092 have died. Breakdown of testing by 3 of the testing strategy ‘pillars’ Daily Cumulative. COVID-19 Resources. Esri. As hundreds of millions of eyes stay glued to the rising toll and reach of the novel coronavirus disease 2019 (COVID-19), map-based dashboards have become a compelling, near real-time way to monitor the outbreak.
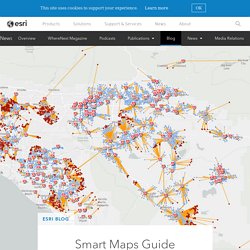
They’ve also substantiated the message that everyone must take precautions and alter daily interactions. When the World Health Organization (WHO) declared COVID-19 a pandemic, director-general Tedros Adhanom Ghebreyesus warned that the situation would worsen. Yet, he noted, this is the first world pandemic that can be controlled, in part due to global connectivity and awareness. The controllability of COVID-19 can also be attributed to tools that quantify data inputs—and aggregate information about who and when in the context of where. Geographic information system (GIS) technology underpins mapping dashboards and provides the means to investigate and understand the spread, guide control measures, and assess strategies for COVID-19 response. Coronavirus : suivez la propagation de la pandémie en France et dans le monde.
Cette page est obsolète. Infection à coronavirus. Coronavirus (SRAS-CoV et MERS-CoV) Info Coronavirus COVID-19. Informations sur les mesures nationales entre 19h et 6h (couvre-feu), partout sur le territoire, obligation de présenter une attestation dérogatoire au couvre-feu lors des déplacements. les sorties et déplacements sans attestations dérogatoires sont interdits de 19h00 à 06h00, sous peine d’une amende de 135 € et jusqu’à 3750 € en cas de récidive. les établissements autorisés à ouvrir ne pourront plus accueillir de public après 19h00. Par ailleurs, les contrôles sont renforcés sur la voie publique pour limiter les rassemblements et encadrer la consommation d’alcool. Concernant les commerces autorisés à ouvrir : seuls ceux vendant des biens et des services de première nécessité seront autorisés à ouvrir – auxquels s’ajoutent les librairies, les disquaires, les magasins de bricolage, de plantes et de fleurs, les coiffeurs, les cordonniers, les chocolatiers, les concessions automobiles, les visites de biens immobiliers – afin de réduire les contacts dans les lieux clos.
Éducation Hôpitaux. Plateforme téléphonique -Coronavirus (SARS-CoV-2, Covid-19) : numéros utiles. Coronavirus Covid-19 (ex 2019-nCov) Publié le31.03.20mise à jour15.05.20. Situation update worldwide. Data presented on this page are collected between Monday and Wednesday for the preceding week and published on Thursdays Disclaimer: National updates are published at different times and in different time zones. This, and the time ECDC needs to process these data, may lead to discrepancies between the national numbers and the numbers published by ECDC. Users are advised to use all data with caution and awareness of their limitations. Data are subject to retrospective corrections; corrected datasets are released as soon as processing of updated national data has been completed. Download latest data How are the data collected?