
Maps API Premier - Visualisez vos données. Google Map fichiers KML Icône. Map. Maps are used so widely in web design and they are usually expected to be interactive when presenting data.

It can be the branches of an international company, statistics about countries or just destinations to visualize. Like said, lots of uses. Simplemaps is a website that provides professional, highly-customizable and interactive maps built with JavaScript and SVG (or Flash). SVG has a wide browser-support and it works very well on mobile + tablet as well. There are maps for “world/countries, continents, USA and Canada” and the usage +customization doesn’t require advanced development knowledge. Also, Simplemaps website has an online customization tool that enables the users to edit the countries, change colors, descriptions, links and more. Considering that the maps are in vector (SVG), tiny or huge, they work great on all sizes.
With some JavaScript, it is so easy to add new features to them like tooltips, selectable regions and much more. P.S. How to join the giveaway? Good luck to all. Gmaps.js — the easiest way to use Google Maps. jVectorMap – A jQuery Plugin For Vector Maps.
Flash was the tool for creating interactive maps where we can hover or click any region and see details about them. Right now, it is easier to create maps with JavaScript and, thanks to JS frameworks, it even gets much simpler. jVectorMap is a jQuery plugin for creating such interactive maps very quickly. It uses SVG as the map format and there are various ready-to-use map files provided. Also, using a vector graphics editor (like Adobe Illustrator), we can draw anything (like the map of a shopping mall), export it to SVG and add interactivity to it.
There are options provided for customization (colors, opacity, etc.) and callbacks exist on every level. P.S. P.S.2 If you are in search of vector freebies, checks these vector images. Exhibit. jQuery Gantt: Créez des diagrammes de Gantt avancés avec jQuery. jQuery Gantt est un plugin permettant de créer des diagrammes de Gantt web interactifs et avancés.
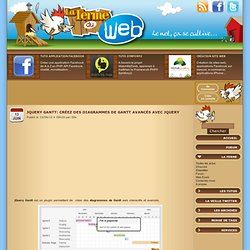
Si vous développez votre propre intranet de développement ou une solution de gestion de projet pour un client, cette ressource va vous rendre pas mal de services ! En effet, ce plugin jQuery vous permettra de mettre en place le fameux diagramme de Gantt facilement et rapidement configurable. Vous pouvez l'utiliser pour organiser vos sprints et disposez vos tâches par catégories, couleurs... La navigation est vraiment bien pensée, avec un système de zoom et dé-zoom pour avoir une vue plus générale des différentes tâches. Un slider vous permet d'évoluer facilement dans la chronologie du diagramme avec la souris. Sur le hover de la souris, vous pouvez afficher plus de détail sur la tâche ...
Côté utilisation, le plugin se met en place rapidement et dispose de plusieurs options: 01. 02. source: "ajax/data.json", Gauge.js (javascript programmable gauge) <form name="lst" id="lst" method="post" action=".. gauge.js 1.4 allows you to add gauges (with shading and reflection) to your webpages.
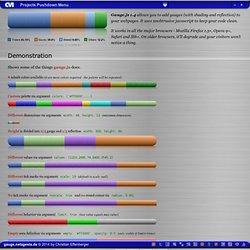
It uses unobtrusive javascript to keep your code clean. It works in all the major browsers - Mozilla Firefox 1.5+, Opera 9+, Safari and IE6+. On older browsers, it'll degrade and your visitors won't notice a thing. The Internet Explorer implementation has a limitation of a maximum of 14 values for reasons that are inherent in the used vml fill parameter "colors". Because of Operas different behavior (in comparison with gecko and webkit) when using "globalCompositeOperation", the presentation differs. Javascript Graphs and Charts libraries.