
Edit fiddle. Stephen Boak — Tutorial: Network Flow Visualizations With Directed Edges in D3. Back in May I posted some network visualization experiments we did at Boundary to the Boundary Blog.
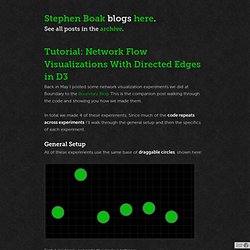
This is the companion post walking through the code and showing you how we made them. In total we made 4 of these experiments. Since much of the code repeats across experiments I’ll walk through the general setup and then the specifics of each experiment. General Setup All of these experiments use the same base of draggable circles, shown here: First, I randomly generate the circle positions: var width = 600, height = 300; var radius = 25; /* radius of circles */ var numCircles = 6; /* number of circles to make */ /* array of random x,y coords for circles, away from edges */ var circles = d3.range(numCircles).map(function(i, d) { return [ Math.round(50 + (i/numCircles)*(width - 50)), Math.round(30 + Math.random()*(height - 80)) ]; }); After creating the SVG element, and a group to contain the circles, I append the circles to the new group… Scales and Links Straight Edges Arrows Tapers, Joined.
d3.js: force layout with self-referencing links. Derived from the D3.js example force_cluster.html and gist 3104394.
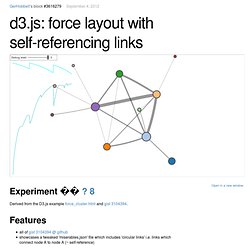
Usage Slide the 'debug level' slider to see the various debug levels visually; the hospital curves are (top): force.alpha and (bottom) total x/y change squared: a measurement for the amount of movement of nodes in the graph. Note that the bottom curve is inverted, so that when both meet, you're getting close to done. :-)Click on node to expand or collapse. Treevis.net.
Force layout graph with colour-coded node neighbours. Other tools- reference. _User_Manual/Visual_Styles - Cytoscape Wiki. What is a Visual Style?
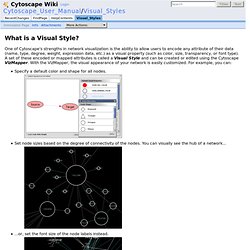
One of Cytoscape's strengths in network visualization is the ability to allow users to encode any attribute of their data (name, type, degree, weight, expression data, etc.) as a visual property (such as color, size, transparency, or font type). A set of these encoded or mapped attributes is called a Visual Style and can be created or edited using the Cytoscape VizMapper. With the VizMapper, the visual appearance of your network is easily customized. For example, you can: Specify a default color and shape for all nodes. Cytoscape 2.6.0 and later versions have additional sample Visual Styles. The VizMapper can be accessed by going to View → Open VizMapper or by clicking on the VizMapper icon . Introduction to the VizMapper User Interface There are three types of control panels in the VizMapper: Main Panel This panel allows you to create/delete/view/switch between different visual styles using the Current Visual Style options. D3.js Tips and Tricks: d3.js force directed graph example (basic)
The following post is a portion of the D3 Tips and Tricks document which is free to download.

Abusing The Force Talk - Jim Vallandingham. How to Make an Interactive Network Visualization. Networks!
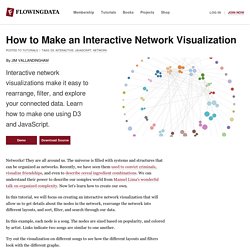
They are all around us. The universe is filled with systems and structures that can be organized as networks. Recently, we have seen them used to convict criminals, visualize friendships, and even to describe cereal ingredient combinations. We can understand their power to describe our complex world from Manuel Lima's wonderful talk on organized complexity. Now let's learn how to create our own. In this tutorial, we will focus on creating an interactive network visualization that will allow us to get details about the nodes in the network, rearrange the network into different layouts, and sort, filter, and search through our data.
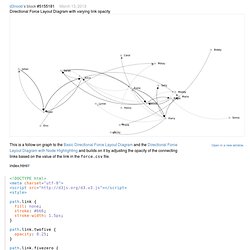
In this example, each node is a song. Directional Force Layout Diagram with varying link opacity. Directional Force Layout Diagram with varying link opacity.
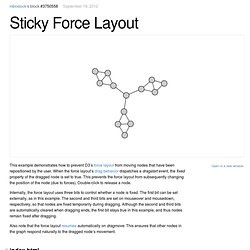
Directed Graph Editor. Sticky Force Layout. This example demonstrates how to prevent D3’s force layout from moving nodes that have been repositioned by the user.
Force-Directed Symbols.
Transforms GraphSON into D3 JSON. Build Your Own Graph! Multi-Foci Force Layout. Multitouch Drag. Force Editor + Pan/Zoom. Fisheye Distortion. It can be difficult to observe micro and macro features simultaneously with complex graphs.
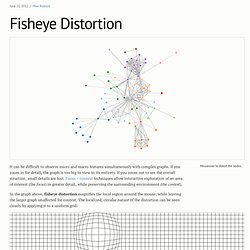
If you zoom in for detail, the graph is too big to view in its entirety. If you zoom out to see the overall structure, small details are lost. Focus + context techniques allow interactive exploration of an area of interest (the focus) in greater detail, while preserving the surrounding environment (the context). In the graph above, fisheye distortion magnifies the local region around the mouse, while leaving the larger graph unaffected for context. The localized, circular nature of the distortion can be seen clearly by applying it to a uniform grid: This type of distortion is particularly useful for disambiguating edge-crossings in static network layouts: edges between distant nodes are distorted more strongly than local ones. #Cartesian Distortion Circular fisheye is only one of many possible distortion functions. #Implementation. Delaunay Force Mesh.
Brushable Network, II.