
Superconductor: Big Data Visualization for the Web. Superconductor is a web framework for creating data visualizations that scale to real-time interactions with up to 1,000,000 data points.

It compiles to WebCL, WebGL, and web workers to unleash the power of parallel hardware for fast and cross-platform data visualization. Learn more » Caution Superconductor is currently available as a developer preview. We want to give you an early look at what we're up to, but there are still a lot of rough spots. Get It Get started viewing Superconductor visualizations, or create your own.
View more » Examples A preview of some of the demos that come with the Superconductor code. View more » Documentation Learn how to create visualizations with Superconductor, and integrate it into your site. Linked Micromaps - Geographic Information Systems & Science. Linked Micromaps is a graphing program written in Java.

It allows users to view multiple variables interactively and compare statistics across regions (states, counties, registries, hospitals) as well as across time. It supports six types of graph: bar graphs; box plots; raw data tables; point graphs; point graphs with arrow; and point graphs with confidence intervals.
Click the thumbnails to see larger sample images of Linked Micromaps output. In order to use Linked Micromaps, you must have Java. Timeline-setter creator. Project. Storytelling without limits.
Whitey Bulger WBUR Boston Issue 9 | May 2013from Rhetoric for Carpenters (proverbs) by Toby Altman“Father’s Day” by Bobby Fischer“The Beast Deer” by Cassandra de Alba“[What Happens in this Town Stays in this Town]” by Katie Byrum“If You Never Get to Mendocino County” by Matthew Wade Jordanfrom Rhetoric for Carpenters (proverbs)Toby Altman(a) Do not allow insult:language should be a thimbleto shield your brother’s thumb.
(b) Do not tell your firstbornthe story of Isaac:you just never know. (c) Do not let yourself speakabout the unknowable. Bodega: Issue 9 The Rider’s Prayer Sarah Menkedick Make beautiful multimedia stories for apps, ebooks, and the Web with a free Creatavist account . Datahero. Tree Visualization. Datawrapper. Hive Plots - Linear Layout for Network Visualization - Visually Interpreting Network Structure and Content Made Possible. NodeXL: Network Overview, Discovery and Exploration for Excel - Home. Chartio - The Easiest Business Dashboard You'll Ever Use. Gephi, an open source graph visualization and manipulation software.
Weka 3 - Data Mining with Open Source Machine Learning Software in Java. Weka is a collection of machine learning algorithms for data mining tasks. It contains tools for data preparation, classification, regression, clustering, association rules mining, and visualization. Found only on the islands of New Zealand, the Weka is a flightless bird with an inquisitive nature. The name is pronounced like this, and the bird sounds like this. Weka is open source software issued under the GNU General Public License. The R Project for Statistical Computing. NodeBox. Processing.org. Create beautiful dynamic data driven maps. Kartograph.org. OpenLayers: Home. Polymaps. Leaflet - a JavaScript library for mobile-friendly maps. Modest Maps. Tangle: a JavaScript library for reactive documents. Tangle is a JavaScript library for creating reactive documents.
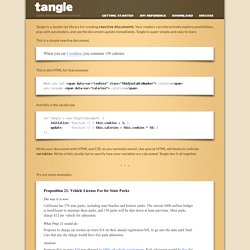
Your readers can interactively explore possibilities, play with parameters, and see the document update immediately. Tangle is super-simple and easy to learn. This is a simple reactive document. When you eat 3 drag cookies, you consume 150 calories. This is the HTML for that example. When you eat <span data-var="cookies" class="TKAdjustableNumber"> cookies</span>, you consume <span data-var="calories"> calories</span>. And this is the JavaScript. Write your document with HTML and CSS, as you normally would. Try out some examples. Proposition 21: Vehicle License Fee for State Parks The way it is now: California has 278 state parks, including state beaches and historic parks. What Prop 21 would do: Proposes to charge car owners an extra $18 on their annual registration bill, to go into the state park fund. Analysis: Suppose that an extra $18 was charged to 100.
Crossfilter. Fast Multidimensional Filtering for Coordinated Views Crossfilter is a JavaScript library for exploring large multivariate datasets in the browser.
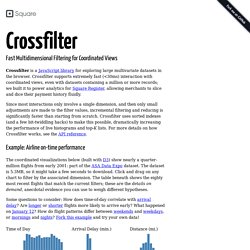
Crossfilter supports extremely fast (<30ms) interaction with coordinated views, even with datasets containing a million or more records; we built it to power analytics for Square Register, allowing merchants to slice and dice their payment history fluidly. Since most interactions only involve a single dimension, and then only small adjustments are made to the filter values, incremental filtering and reducing is significantly faster than starting from scratch. Crossfilter uses sorted indexes (and a few bit-twiddling hacks) to make this possible, dramatically increasing the performance of live histograms and top-K lists. For more details on how Crossfilter works, see the API reference. Example: Airline on-time performance February 28, 2001. D3.js - Data-Driven Documents. Raphaël—JavaScript Library. Flot: Attractive JavaScript plotting for jQuery.
Charts. Data Insights. Made Social. Create and share visual ideas online. Dipity - Find, Create, and Embed Interactive Timelines. Quadrigram.