
R - Heatmap color key with five different colors. Mathematical Annotation in R. R Core Team (R-core@R-project.org ) The R Project for Statistical Computing.
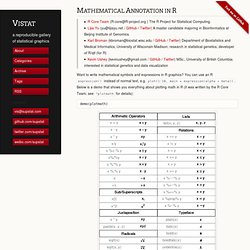
Lijia Yu (yu@lijiayu.net / GitHub / Twitter) A master candidate majoring in Bioinformatics at Beijing Institute of Genomics. Karl Broman (kbroman@biostat.wisc.edu / GitHub / Twitter) Department of Biostatistics and Medical Informatics, University of Wisconsin-Madison; research in statistical genetics; developer of R/qtl (for R) Kevin Ushey (kevinushey@gmail.com / GitHub / Twitter) MSc., University of British Columbia; interested in statistical genetics and data visualization Want to write mathematical symbols and expressions in R graphics? You can use an R expression() instead of normal text, e.g. plot(1:10, main = expression(alpha + beta)). Below is a demo that shows you everything about plotting math in R (it was written by the R Core Team; see ? If you want to combine multiple mathematical expressions with text, use paste() insideexpression(), as in the following. 918 Gratz St, Knoxville, TN 37917 to 2743 Wimpole Ave, Knoxville, TN 37914 - Google Maps.
Tutorial on Making Simple R Packages. This tutorial was written against R version 2.7.1 (2008-06-23) on Ubuntu 7.10, set up as described here.
Your mileage may vary. The example below will fail to package on Windows unless you have a FORTRAN compilation environment suitable for R. Goal. Likert {HH. Diverging stacked barcharts for Likert, semantic differential, rating scale data, and population pyramids.
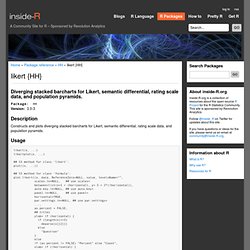
Description Constructs and plots diverging stacked barcharts for Likert, semantic differential, rating scale data, and population pyramids. Usage Arguments x.
RStudio. FAQ. This is the FAQ, currently under construction.
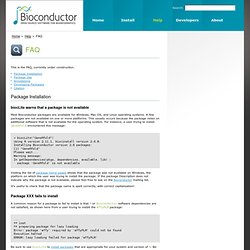
Package Installation biocLite warns that a package is not available Most Bioconductor packages are available for Windows, Mac OS, and Linux operating systems. A few packages are not available on one or more platforms. This usually occurs because the package relies on additional software that is not available for the operating system. Histograms in R. There are a number of important types of plots that are used in descriptive statistics.
A common plot that is frequently used in newspapers and magazines is the histogram, a sequence of vertical bars, where the height of each bar represents a count of the data values falling in a "bin. " The "count", "bins", and "bars" will be explained in the images that follow. Creating a Histogram of the Standard Normal Distribution The standard normal distribution is the famous "bell-shaped" curve of statistics, known to have a mean value of zero and a standard deviation of one. If you are not familiar with the standard normal distribution, read on. An Introduction to R. Table of Contents This is an introduction to R (“GNU S”), a language and environment for statistical computing and graphics.
R is similar to the award-winning1 S system, which was developed at Bell Laboratories by John Chambers et al. It provides a wide variety of statistical and graphical techniques (linear and nonlinear modelling, statistical tests, time series analysis, classification, clustering, ...). This manual provides information on data types, programming elements, statistical modelling and graphics. Example of using R Markdown. This post examines the features of [R Markdown]( using [knitr]( in Rstudio 0.96.
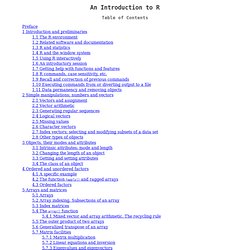
This combination of tools provides an exciting improvement in usability for [reproducible analysis]( R: Basic R Skills – Splitting and Plotting. If (!
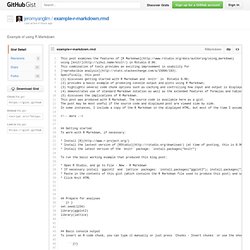
Require(RColorBrewer)){ install.packages("RColorBrewer") library(RColorBrewer) ### Generate a random data set data <- data.frame(names=c("Type1","Type2")[as.numeric((runif(n=100)>=0.5))+1],data=rnorm(100,100,sd=25)) R - image of a pixel matrix. How to Install an R Package. Longhai Li, Department of Mathematics and Statistics, University of Saskatchewan I occacionally publish R add-on packages for others to implement and test the statistical methodoglogies I discuss in my papers.
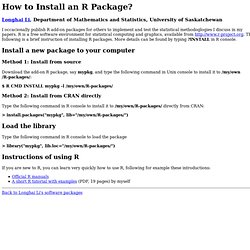
R is a free software environment for statistical computing and graphics, available from The following is a brief instruction of installing R packages. More details can be found by typing ? Plotting a matrix as an image in R. Control Structures. R has the standard control structures you would expect. expr can be multiple (compound) statements by enclosing them in braces { }.
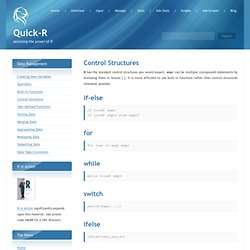
It is more efficient to use built-in functions rather than control structures whenever possible. if-else if (cond) expr if (cond) expr1 else expr2. R: Eigenvector/Eigenvalue Decomposition. Description eigenval computes the real parts of the eigenvalues of a square matrix. eigenvec computes the real parts of the eigenvectors of a square matrix. ieigenval computes the imaginary parts of the eigenvalues of a square matrix. ieigenvec computes the imaginary parts of the eigenvectors of a square matrix. eigenval and ieigenval return nx1 matrices containing the real or imaginary parts of the eigenvalues, sorted in decreasing order of the modulus of the complex eigenvalue.
For eigenvalues without an imaginary part, this is equivalent to sorting in decreasing order of the absolute value of the eigenvalue. (See Mod for more info.) eigenvec and ieigenvec return nxn matrices, where each column corresponds to an eigenvector. These are sorted in decreasing order of the modulus of their associated complex eigenvalue. Usage. Conditional Statements in "R"
R by example. Basics Reading files Graphs Probability and statistics. R for MATLAB users – Mathesaurus. Help Searching available documentation Using interactively Operators Arithmetic operators Relational operators Logical operators root and logarithm Round off Mathematical constants. Ubuntu Start Page. SeqinR library content (alpha version)
1. Introduction2. The three ways to access to sequences3. David Buehler- Research Program. The Buehler Lab in Avian Ecology and Conservation Science My research interests are focused on understanding factors that limit wildlife populations, especially for avian species that are declining and thus in need of management. I develop spatially-explicit wildlife habitat models in geographic information systems as a means to evaluate landscape-scale management relationships. I am also interested in monitoring and managing for biological diversity. Most of my research is conducted with MS and PhD level graduate students at the University of Tennessee. Contact myself or my students listed below for more information on a given project. Easily input a correlation matrix in R. R – Sorting a data frame by the contents of a column « Developmentality. Plyr - R Grouping functions: sapply vs. lapply vs. apply. vs. tapply vs. by vs. aggregate vs.
R - Plot correlation matrix into a graph. Correlation. Correlation, Factor Analysis, and Principal Components Analysis are different than the other procedures in DTREG, because they do not generate predictive models. Instead, these procedures are used for exploratory analysis where you are trying to understand the nature and relationship between variables. Introduction to Correlation. Data Frame Row Slice. We retrieve rows from a data frame with the single square bracket operator, just like what we did with columns. A brief introduction to “apply” in R. Using SyntaxHighlighter and R Brush in Blogger.
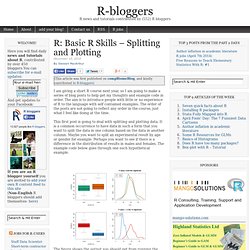
Data Management. Facets (ggplot2) Multiple plots in one subplot. Lecture: Graphing in R. Producing Simple Graphs with R. Software and Programmer Efficiency Research Group. A plot can be themed by adding a theme. ggplot2 provides two built-in themes: theme_grey() - the default theme, with a grey background theme_bw() - a theme with a white background. Ggplot2 - How can we make xkcd style graphs in R. Examples of the R function ddply in action. The ddply function in R is a really power tool. In this post I will show how it can be used by a few examples. ddply takes three basic argumentsthe input dataset the splitting identifiers the function to apply to the splitted datasets Split data set in groups with identical id's and for each group produce one row containing the splitting variables and the values defined after the summarise parameter.
> timespan <- ddply(baseball, . (id), summarise, start = min(year), end = max(year)) > timespan[1:3, ] id start end1 abernte02 1955 19722 adairje01 1958 19703 adamsba01 1906 1926. An introduction to plyr: understanding large data with many models. A common pattern in the analysis of large data is to perform the same analysis on many (many many) smaller subsets of data. In this tutorial you will learn some basic statistical and computation strategies for solving this type of problem.
During the course of the tutorial we will fit tens of thousands of linear models to a variety of datasets and explore how we can summarise the results to gain insight into our data. The basic steps of large data analysis that we will follow are: Identify and fit an appropriate model for a single subset of the data Fit the model to every subset Examine model fit statistics to identify subsets that don’t follow the same pattern, and modify and refit the model if necessary Look at coefficients and other summary statistics across all subsets Create a single model that summarises the many smaller models.
RStudio. How I install a R package? How I install a R package? Dear R users: as you have probably experienced, many of the times that we think a new R package is going to save our life, it ends up just frustrating us. In the meanwhile, we have asked Angel or Edu to install such a promising package, wasting their time (and ours) in vain and waiting for what would be useless. A way to improve the work flow and accelerate the test of new packages is to install first the package locally. And then, if worthwhile, ask for the system installation. To easily do the local installation of a CRAN package: e.g. to install the package clv:
Writing data to a file. b5.R.