
Calculating the parameters of a Beta distribution using the mean and variance. Dr. Brian R. Kent - National Radio Astronomy Observatory - Mathematica Notebooks. Mathematica Notebooks The Mathematica animation at right shows a Mobius strip with specular lighting applied.
Listed here are some interesting exercises in astronomy, physics, and graphics with Mathematica... Statistics 2 - Correlation Coefficient and Coefficient of Determination. Correlation Coefficient How well does your regression equation truly represent your set of data?
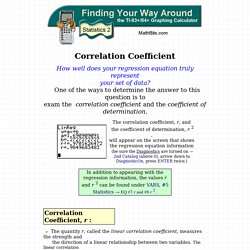
One of the ways to determine the answer to this question is to exam the correlation coefficient and the coefficient of determination. The quantity r, called the linear correlation coefficient, measures the strength and the direction of a linear relationship between two variables. The linear correlation coefficient is sometimes referred to as the Pearson product moment correlation coefficient in honor of its developer Karl Pearson. The mathematical formula for computing r is: Dr. Bunsen / Bootstrap in Picture. Introduction I was waiting in line at my local bank recently and spotted an urn filled with coins on a table in the corner of the lobby.
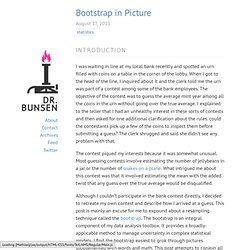
When I got to the head of the line, I inquired about it and the clerk told me the urn was part of a contest among some of the bank employees. The objective of the contest was to guess the average mint year among all the coins in the urn without going over the true average. I explained to the teller that I had an unhealthy interest in these sorts of contests and then asked for one additional clarification about the rules: could the contestants pick up a few of the coins to inspect them before submitting a guess? The clerk shrugged and said she didn’t see any problem with that. The contest piqued my interests because it was somewhat unusual. Overview In many scenarios, it’s too expensive or in some way infeasible to draw many random samples from a population in order to find an underlying sampling distribution for a statistic. Experiment Confidence Issues. Linear Systems of ODEs.
Tutorials Here is a system of two ODEs whose coefficient matrix has real and distinct eigenvalues.
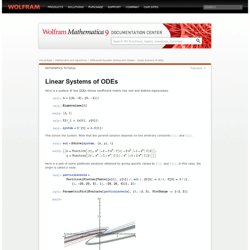
This solves the system. Note that the general solution depends on two arbitrary constants C [1] and C [2] . Here is a plot of some particular solutions obtained by giving specific values to C [1] and C [2] . ¥firstsys.nb - firstsys.pdf. Is the Problem Well-Posed? Tutorials DSolve returns a general solution for a problem if no initial or boundary conditions are specified.
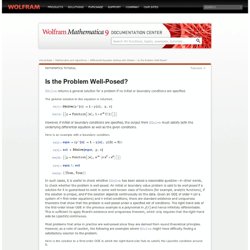
The general solution to this equation is returned. However, if initial or boundary conditions are specified, the output from DSolve must satisfy both the underlying differential equation as well as the given conditions. Here is an example with a boundary condition. In such cases, it is useful to check whether DSolve has been asked a reasonable question—in other words, to check whether the problem is well-posed. Assumptions and Domains. Solving a system of differential equations. Using Assumptions. Mathematica normally makes as few assumptions as possible about the objects you ask it to manipulate.
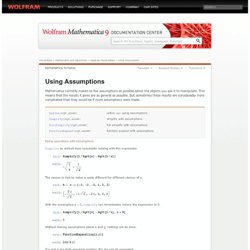
This means that the results it gives are as general as possible. But sometimes these results are considerably more complicated than they would be if more assumptions were made. Doing operations with assumptions. Simplify by default does essentially nothing with this expression. Confidence Intervals. Quasi-Monte Carlo Simulation. Monte Carlo Simulation Basics. [ Preface ] [ Sales Forecast Example ] A Monte Carlo method is a technique that involves using random numbers and probability to solve problems.
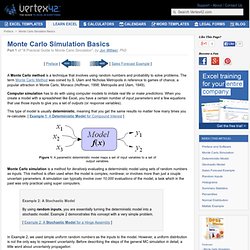
The term Monte Carlo Method was coined by S. Ulam and Nicholas Metropolis in reference to games of chance, a popular attraction in Monte Carlo, Monaco (Hoffman, 1998; Metropolis and Ulam, 1949). Computer simulation has to do with using computer models to imitate real life or make predictions. Using Excel to do Basic Statistical Tests. Before you do statistical tests, it’s important to understand what they are.
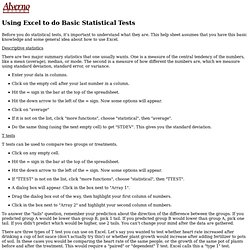
This help sheet assumes that you have this basic knowledge and some general idea about how to use Excel. Descriptive statistics There are two major summary statistics that one usually wants. Most researchers don’t understand error bars – Cognitive Daily. [This post was originally published in March 2007] Earlier today I posted a poll [and I republished that poll yesterday] challenging Cognitive Daily readers to show me that they understand error bars — those little I-shaped indicators of statistical power you sometimes see on graphs.
I was quite confident that they wouldn’t succeed. Why was I so sure? Because in 2005, a team led by Sarah Belia conducted a study of hundreds of researchers who had published articles in top psychology, neuroscience, and medical journals. Only a small portion of them could demonstrate accurate knowledge of how error bars relate to significance. The Binomial Distribution.
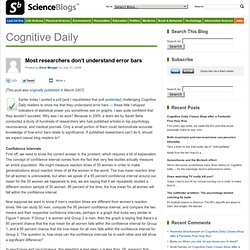
Obtaining a beta distribution through specification of mean and variance. Beta distribution - Math Wiki. Copied from Wikipedia.
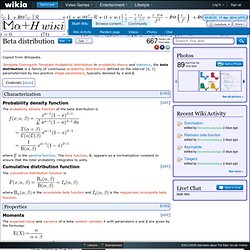
Template:DistinguishTemplate:Probability distribution In probability theory and statistics, the beta distribution is a family of continuous probability distributions defined on the interval [0, 1] parameterized by two positive shape parameters, typically denoted by α and β. Characterization[edit] Probability density function[edit] Calculating the parameters of a Beta distribution using the mean and variance. 7.4.3.2. The 1-way ANOVA model and assumptions. Journal of Mathematical Psychology - Tutorial on maximum likelihood estimation. Abstract In this paper, I provide a tutorial exposition on maximum likelihood estimation (MLE).
Visualizing Bayes’ theorem. I recently came up with what I think is an intuitive way to explain Bayes’ Theorem. I searched in google for a while and could not find any article that explains it in this particular way. Of course there’s the wikipedia page, that long article by Yudkowsky, and a bunch of other explanations and tutorials.
Help:Displaying a formula. MediaWiki uses a subset of AMS-LaTeX markup, a superset of LaTeX markup which is in turn a superset of TeX markup, for mathematical formulae. It generates PNG images by default. Alternatively the MathJax renderer can be used, this uses a combination of HTML and CSS to display the equation, it can be selected in the user preferences. Although, in all cases mentioned, TeX is generated by compilation, and not by an interpreter program, there is one essential difference between, e.g., Knuth's TeX or Lamport's LaTeX and the present implementation: whereas in the first two cases the compiler typically generates an all-in-one printable output, which has the quality of a whole book with all chapters, sections and subsections, and where no line is "special", in the present case one has, typically, a mixture of TeX images (more precisely: PNG images) for the equations, embedded into usual text, and with short TeX elements usually replaced by HTML parts.
Basics[edit] LaTeX commands[edit] Color[edit] Poisson Distribution. A Poisson distribution is the probability distribution that results from a Poisson experiment. GMS:Stochastic Modeling - XMS Wiki - There are two methods in GMS for stochastic modeling using MODFLOW 2000. The first, parameter zonation, uses either a Random Sampling, Latin Hypercube Sampling, or Gaussian Fields to generate the different realizations. The second approach uses indicator simulations generated by T-PROGS. Sampling and sensitivity analyses tools (SaSAT) for computational modelling. Untitled. Ecological Archives E085-056-A4. Ecological Archives E085-056-A4 Brigitte Tenhumberg, Andrew J. Sloot2002d.pdf (application/pdf Object) Introduction to Differential Equation Solving with DSolve.
Statistics 2 - Correlation Coefficient and Coefficient of Determination. Maximum Likelihood. Maximum Likelihood. Exponential Growth. Crash Course: Ch. 3 - Exponential Growth & Ch. 4 - The Power of Compounding by Chris Martenson. Partial correlation. PAGE RETIRED: Click here for the new StatsDirect help system. Partial correlation is a method used to describe the relationship between two variables whilst taking away the effects of another variable, or several other variables, on this relationship. Partial correlation is best thought of in terms of multiple regression; StatsDirect shows the partial correlation coefficient r with its main results from multiple linear regression.
A different way to calculate partial correlation coefficients, which does not require a full multiple regression, is show below for the sake of further explanation of the principles: Consider a correlation matrix for variables A, B and C (note that the multiple line regression function in StatsDirect will output correlation matrices for you as one of its options): Exponential Functions: The "Natural" Exponential "e"