
Correction for significance when using multiple regression model? [Q] : statistics. Post Hoc Statistical Procedures. Analysis of covariance (ANCOVA) answers the question: What are the differences in the posttest scores if I hold constant the pretest scores?

It is a procedure, like blocking and matching, that can be used to control for differences in pretest scores. ANCOVA can be used in either experimental or quasi-experimental designs. The procedures used in blocking and matching are very mechanical. 1605481576493 GIF. Interpreting Residual Plots to Improve Your Regression - Qualtrics Support. When you run a regression, Stats iQ automatically calculates and plots residuals to help you understand and improve your regression model.

Read below to learn everything you need to know about interpreting residuals (including definitions and examples). Observations, Predictions, and Residuals To demonstrate how to interpret residuals, we’ll use a lemonade stand data set, where each row was a day of “Temperature” and “Revenue.” The regression equation describing the relationship between “Temperature” and “Revenue” is: Revenue = 2.7 * Temperature – 35 Let’s say one day at the lemonade stand it was 30.7 degrees and “Revenue” was $50.
So if we insert 30.7 at our value for “Temperature”… Revenue = 2.7 * 30.7 – 35Revenue = 48 …we get $48. Your model isn’t always perfectly right, of course. Residual = Observed – Predicted You can imagine that every row of data now has, in addition, a predicted value and a residual. The feedback you submit here is used only to help improve this page. My stats professor just went on a rant about how R-squared values are essentially useless, is there any truth to this? : statistics. Standard Error of the Regression vs. R-squared - Statistics By Jim.
Sum of Squares - Definition, Formulas, Regression Analysis. Sum of squares (SS) is a statistical tool that is used to identify the dispersion of data as well as how well the data can fit the model in regression analysisRegression Analysis.
The sum of squares got its name because they are calculated by finding the sum of the squared differences. This image is only for illustrative purposes. The sum of squares is one of the most important outputs in regression analysis. The general rule is that a smaller sum of squares indicates a better model as there is less variation in the data. Errors-in-variable regression: Use & misuse - measurement error, equation error, method of moments, orthogonal regression, major axis regression, allometry. Statistics courses, especially for biologists, assume formulae = understanding and teach how to do statistics, but largely ignore what those procedures assume, and how their results mislead when those assumptions are unreasonable.
The resulting misuse is, shall we say, predictable... What is the difference between correlation and linear regression? - FAQ 1141 - GraphPad. When investigating the relationship between two or more numeric variables, it is important to know the difference between correlation and regression.
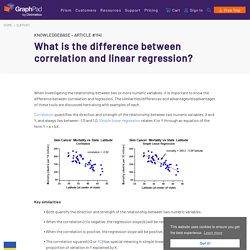
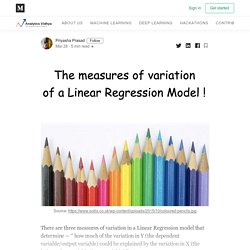
The similarities/differences and advantages/disadvantages of these tools are discussed here along with examples of each. Correlation quantifies the direction and strength of the relationship between two numeric variables, X and Y, and always lies between -1.0 and 1.0. The measures of variation of a Linear Regression Model ! Priyasha Prasad Mar 28 · 5 min read There are three measures of variation in a Linear Regression model that determine — “ how much of the variation in Y (the dependent variable/output variable) could be explained by the variation in X (the independent variable/input variable) ”.
Restriction of range: what it is and why it matters – Fredrik deBoer. Let’s imagine a bit of research that we could easily perform, following standard procedures, and still get a misleading result.
Say I’m an administrator at Harvard, a truly selective institution. I want to verify the College Board’s confidence that the SAT effectively predicts freshman year academic performance. I grab the SAT data, grab freshmen GPAs, and run a simple Pearson correlation to find out the relationship between the two. To my surprise, I find that the correlation is quite low. I resolve to argue to colleagues that we should not be requiring students to submit SAT or similar scores for admissions, as those scores don’t tell us anything worthwhile anyway. Ah. Restricted Range - Statistics How To. Pearson Correlation Coefficient > Restricted Range What is a Restricted Range?
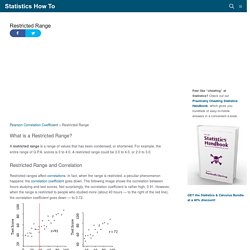
A restricted range is a range of values that has been condensed, or shortened. For example, the entire range of G.P.A. scores is 0 to 4.0. WooldridgeCh10 12. Visualization of the relationship between variance and covariance : 3Blue1Brown. Sum of Squares - Definition, Formulas, Regression Analysis. Prism 7 Curve Fitting Guide - R squared.
Meaning of R2 Key points about R2 •The value R2 quantifies goodness of fit.
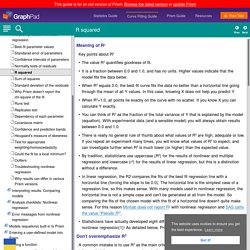
•It is a fraction between 0.0 and 1.0, and has no units. Higher values indicate that the model fits the data better. •When R2 equals 0.0, the best-fit curve fits the data no better than a horizontal line going through the mean of all Y values. •When R2=1.0, all points lie exactly on the curve with no scatter. Generalized Linear Model - an overview. 5.2.4 Generalized Linear Models The generalized linear model (GLM) is a generative model in wide use in many statistical problems.

In the context of modeling population activity, GLM models the output of each neuron in terms of a conditional intensity function, of a stochastic point process, where models all of the factors that influence neuron output (Okatan et al., 2005; Truccolo et al., 2005). GLM Theory. QMIN09 GLMIntro. 2.8 - R-squared Cautions. Unfortunately, the coefficient of determination r2 and the correlation coefficient r have to be the most often misused and misunderstood measures in the field of statistics. To ensure that you don't fall victim to the most common mistakes, we review a set of seven different cautions here. A Refresher on Regression Analysis. You probably know by now that whenever possible you should be making data-driven decisions at work. But do you know how to parse through all of the data available to you? The good news is that you likely don’t have to do the number crunching yourself (hallelujah!)
But you do need to correctly understand and interpret the analysis created by your colleagues. One of the most important types of data analysis is regression. To better understand this method and how companies use it, I talked with Tom Redman, author of Data Driven: Profiting from Your Most Important Business Asset. Reducing Bias and Error in the Correlation Coefficient Due to Nonnormality. Skewness.
User's guide to correlation coefficients. Logistic Regression — Detailed Overview. Logistic Regression was used in the biological sciences in early twentieth century. It was then used in many social science applications. For example, To predict whether an email is spam (1) or (0)Whether the tumor is malignant (1) or not (0) Consider a scenario where we need to classify whether an email is spam or not. If we use linear regression for this problem, there is a need for setting up a threshold based on which classification can be done.
From this example, it can be inferred that linear regression is not suitable for classification problem. Social Research Methods - Knowledge Base - General Linear Model. « PreviousHomeNext » The General Linear Model (GLM) underlies most of the statistical analyses that are used in applied and social research. It is the foundation for the t-test, Analysis of Variance (ANOVA), Analysis of Covariance (ANCOVA), regression analysis, and many of the multivariate methods including factor analysis, cluster analysis, multidimensional scaling, discriminant function analysis, canonical correlation, and others. Because of its generality, the model is important for students of social research. Mws gen reg bck regressionintro. Simple linear regression: Use & misuse - linearity, independence of errors, bias, regression to the mean, errors in variables.
Statistics courses, especially for biologists, assume formulae = understanding and teach how to do statistics, but largely ignore what those procedures assume, and how their results mislead when those assumptions are unreasonable. The resulting misuse is, shall we say, predictable... Making Predictions with Regression Analysis - Statistics By Jim. If you were able to make predictions about something important to you, you’d probably love that, right? How to do Simple Linear Regression in SPSS (14-5) Coefficient of Determination: Definition. More Correlation Coeficients.
Back to the Table of Contents. Regression Table - Statistics Solutions. 5178c4b6cfff1f0fac9001f47d958482e2a1. A guide to appropriate use of Correlation coefficient in medical research. History of Correlation and Association. Pearsons. MMJ2403 0069. WHAT TEST? Bcg comp chapter2. Introduction to Regression Analysis (Statistics Help Tutorial) Why ANOVA and Linear Regression are the Same Analysis. SEM: Multiple Regression (David A. Kenny) How to Identify the Most Important Predictor Variables in Regression Models.
7 Types of Regression Techniques you should know. How to perform an Ordinal Regression in SPSS. Introduction. NHANES Dietary Web Tutorial: Examine the Relationship Between Supplement Use and a Categorical Outcome Using a Chi-Square Test. In cross-sectional surveys such as NHANES, linear regression analyses can be used to examine the association between multiple covariates and a health outcome measured on a continuous scale. For example, we will assess the association between systolic blood pressure (Y) and selected covariates (Xi) in this module. The covariates in this example will include calcium supplement use, race/ethnicity, age, and body mass index (BMI).
Lesson 3: SPSS Regression with Categorical Predictors. General Linear Model. Linear regression. Statistics 2 - Correlation Coefficient and Coefficient of Determination. Chapter9. General Linear Model. Sabermetric Research: On correlation, r, and r-squared. What's a good value for R-squared? Statistics 2 - Correlation Coefficient and Coefficient of Determination. V9N3: Stanton. Guide to Data Entry and Data Analysis. Chapter6.pdf. Parametric versus non-parametric.
Introduction to ANOVA / MANOVA. Difference between ANOVA and MANOVA? How do I interpret data in SPSS for Pearson's r and scatterplots? How do I analyze data in SPSS for Z-scores? Multiple Regression. Types of Statistical Tests. Basic Principles of Experimental Designs.
Residual Analysis in Regression. Multiple Regression with Two Predictor Variables. Correlation. Serial Correlation. Statistics review 7: Correlation and regression. Point-biserial correlation coefficients. OzDASL: Multiple Regression and Multiway ANOVA. Types of Statistical Tests.