
Propensity_score_matching. Dp1588.
Stats and Biostats Contd. Table3. Mann-Whitney. Statistics 101: Visualizing Type I and Type II Error. Statistics 101: Single Sample Hypothesis z-test - Part 1. Chi-square Tutorial. Chi-square Tutorial for Biology 231/425 IntroductionChi-square DistributionA Simple Goodness-of-Fit Chi-square TestTesting for Independent Assortment of GenesTesting for Hardy-Weinberg Equilibrium Introduction.
The chi-square test is used to test "goodness-of-fit" of data to a model. There are several different types of "chi-square" test, as well as other tests that use the "chi-square distribution. " They all have one thing in common. www.ling.upenn.edu/~clight/chisquared.htm. Ling 300, Fall 2008 What is the Chi-square test for?
The Chi-square test is intended to test how likely it is that an observed distribution is due to chance. It is also called a "goodness of fit" statistic, because it measures how well the observed distribution of data fits with the distribution that is expected if the variables are independent. A Chi-square test is designed to analyze categorical data. That means that the data has been counted and divided into categories. IMPORTANT: Be very careful when constructing your categories! 8. The Chi squared tests. The χ²tests The distribution of a categorical variable in a sample often needs to be compared with the distribution of a categorical variable in another sample.
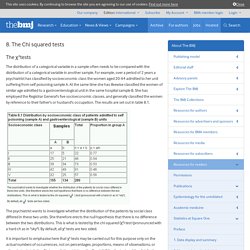
For example, over a period of 2 years a psychiatrist has classified by socioeconomic class the women aged 20-64 admitted to her unit suffering from self poisoning sample A. At the same time she has likewise classified the women of similar age admitted to a gastroenterological unit in the same hospital sample B. She has employed the Registrar General's five socioeconomic classes, and generally classified the women by reference to their father's or husband's occupation. The results are set out in table 8.1. The psychiatrist wants to investigate whether the distribution of the patients by social class differed in these two units. The χ² test is carried out in the following steps: For each observed number (0) in the table find an "expected" number (E); this procedure is discussed below. StatsTests04. Stats For Dummies. Choosing the Correct Statistical Test in SAS, Stata and SPSS. The following table shows general guidelines for choosing a statistical analysis.
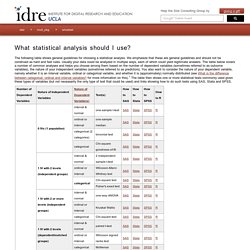
We emphasize that these are general guidelines and should not be construed as hard and fast rules. Usually your data could be analyzed in multiple ways, each of which could yield legitimate answers. The table below covers a number of common analyses and helps you choose among them based on the number of dependent variables (sometimes referred to as outcome variables), the nature of your independent variables (sometimes referred to as predictors). You also want to consider the nature of your dependent variable, namely whether it is an interval variable, ordinal or categorical variable, and whether it is (approximately) normally distributed (see What is the difference between categorical, ordinal and interval variables?
This page was adapted from Choosing the Correct Statistic developed by James D. When to use what Statistical Test. Different statistical tests. There are several different statistical tests you can use, and the best one to pick will depend on the type of data you are dealing with.

Read about some common tests below, and follow the links to more information and videos on each. Chi-squared test The chi-squared test is used with categorical data to see whether any difference in frequencies between your sets of results is due to chance. For example, a ladybird lays a clutch of eggs. You expect that all of the clutch will hatch, but only three-quarters of them do. In a chi-squared test, you draw a table of your observed frequencies and your predicted frequencies and calculate the chi-squared value. This worked example from the Big Picture team is about vitamin C and getting colds. T-test The t-test enables you to see whether two samples are different when you have data that are continuous and normally distributed. Propensity score matching3. Propensity score matching PRIORITY. Propensity score matching2. Propensity score matching. EC823.S2013.nn12.slides.pdf.