
Record to Latitude / Longitude. I'm working with the data set from Streets - Public).
No databases, just files, and I'm using rgeo 0.3.3 and rgeo-shapefile 0.2.2. I can get the shapefile loaded into rgeo pretty well, but I'm having a hard time taking any Point in the file to a specific Latitude/ Longitude. As a proof-of-concept I'm trying to just get the longitude of the first point in the first entry: Leaflet Provider Demo. Leaflet: Past, Present, Future. Tools/Ruby API/README.md at master · CloudMade/Tools. Architecture and Planning. My simple application on OpenShift.
Pulling data from MongoDB and presented using Leaflet.js PaaS: Platform as a Service I write a lot of small applications and scripts to improve my programming skills and to hopefully use in my work. Unfortunately, I cannot share most of them because I don’t have access to a server – almost all of my apps run on a WAMP stack using localhost:8080. Recenlty, I saw a tweet about a service by Red Hat – I remembered them from my Linux club days in college – called OpenShift. What I Want to Build. Albuquerque Registered Historic Places. Demo. Cavis/leafpile. Leaflet-ags/examples/dynamic_tiled.html at master · sanborn/leaflet-ags. RGeo 0.3.20 Documentation. RGeo is a geospatial data library for Ruby.
Summary RGeo is a key component for writing location-aware applications in the Ruby programming language. At its core is an implementation of the industry standard OGC Simple Features Specification, which provides data representations of geometric objects such as points, lines, and polygons, along with a set of geometric analysis operations. This makes it ideal for modeling geolocation data. It also supports a suite of optional add-on modules that provide various geolocation-related services.
Use the core rgeo gem to: Represent spatial and geolocation data objects such as points, lines, and polygons in your Ruby application.Perform standard spatial analysis operations such as finding intersections, creating buffers, and computing lengths and areas.Correctly handle spherical geometry, and compute geographic projections for map display and data analysis.Read and write location data in the WKT and WKB representations used by spatial databases.
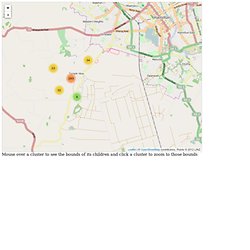
Heyman/leaflet-usermarker. Debug page. Leaflet | © OpenStreetMap contributors, Points © 2012 LINZ Mouse over a cluster to see the bounds of its children and click a cluster to zoom to those bounds.
Using Leaflet.js with non-geographic imagery - Oliver Marriott. Hey!
This was written for Leaflet.js 0.5.1, sorry, it might not work anymore but hopefully it's still helpful. The tileup gem should still be useful. I plan to update the guide when I have time. Leaflet.js is a free & open source javascript mapping library, akin to Google Maps. The tutorials show how easy it is to wire up something like open street maps and start mapping, but it's not so obvious how you can use Leaflet to explore non-geographical imagery (with non lat-lng coordinates).
The steps roughly required are: Split large image into smaller tiles.Rename tiles to fit naming conventions.Insert JS to convert between pixel coordinates and set the max bounds of the map. For this example we'll assume our image is 1024x6144. Examples: Realtime Click Heatmap. This example shows a realtime heatmap with click data, if you click on the surface to the right it will add the datapoint right after the click.
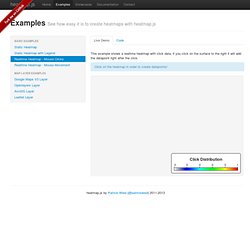
Click on the heatmap in order to create datapoints! Google. GeoMOOSE users - [Geomoose-users] Layer auto refresh. Seems like the approach would work, but I'm still not sure that GeoMOOSE.refreshLayers API was ever implemented (Duck, please correct me if I am wrong).
![GeoMOOSE users - [Geomoose-users] Layer auto refresh](http://cdn.pearltrees.com/s/pic/th/geomoose-users-layer-refresh-65728830)
It could still be done by using a JavaScript interval. There is a similar user extension in trunk (AnimateLayers.js) which cycles through different WMS layer, for example a weather radar loop. Another approach could be using an OpenLayers strategy, see Len ________________________________ From: Reynolds, Michael J. (DOT) [[hidden email]] Sent: Wednesday, November 24, 2010 12:19 PM To: [hidden email]Subject: Re: [Geomoose-users] Layer auto refresh …so… My Ruby on Rails experiences. Leaflet jQuery Controls. Group 1 Town Boundary Bike Racks Group 2. Putting jQuery enabled forms in popups. Folium: Python Data. Leaflet.js Maps. — Folium 0.1.2 documentation. Folium builds on the data wrangling strengths of the Python ecosystem and the mapping strengths of the Leaflet.js library.
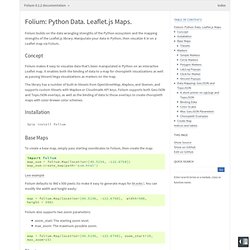
Manipulate your data in Python, then visualize it in on a Leaflet map via Folium. Concept. Build stylish, scalable maps using Leaflet.js. Maps and geographic location data are a big part of our online presence and applications.
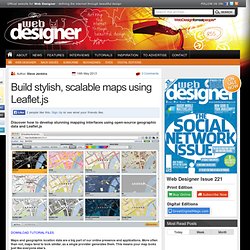
More often than not, maps tend to look similar, as a single provider generates them. MrMufflon/Leaflet.Coordinates. #160 (WMS & AGS Services - legend="false" Not Working (document problem)) – GeoMoose. Leaflet-ags/examples/dynamic_tiled.html at master · sanborn/leaflet-ags. Layer control displaying garbage values. Web Safe Colours Diagram with rgb and hex values. What are web-safe colours?
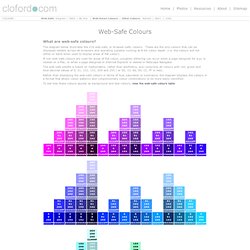
The diagram below illustrates the 216 web-safe, or browser-safe, colours. These are the only colours that can be displayed reliably across all browsers and operating systems running at 8-bit colour depth (i.e. the colours will not dither or band when used to display areas of flat colour). If non-web-safe colours are used for areas of flat colour, unsightly dithering can occur when a page designed for a pc is viewed on a Mac, or when a page designed in Internet Explorer is viewed in Netscape Navigator. The web-safe palette is based on mathematics, rather than aesthetics, and comprises all colours with red, green and blue decimal values of 0, 51, 102, 153, 204 and 255 ( or 00, 33, 66, 99, CC, FF in hex). Rather than displaying the web-safe colours in terms of hue, saturation or luminance, the diagram displays the colours in a format that allows colour patterns and complementary colour combinations to be more easily identified.
Local projections in a world of spherical mercator. Update 2014-02-24: A more thorough and updated version on the topic is The Hitchhiker’s Guide to Tiled Maps. The premise: you want to use the new and cool open source mapping solutions like Leaflet, TileStache and TileMill. While you love projects like OpenStreetMap, you are in a position where you cannot throw out your old map tiles, that are rendered in some local projection, instead of the the one projection to rule them all, spherical mercator.
You need to coerce these tools to use your projection and your tiles. Fortunately, these tools do support local projections, or at least were designed with this support in mind. Yay! A projection (in cartography) is a way of transforming a location on the earth, typically described by a latitude and longitude, to a flat surface (a map) coordinate, like x and y. Tiling means that we chop up a large (sometimes really, truly, huge) bitmap into smaller more manageable bitmaps that can later be put together to appear as one seamless image again.
Touch Support for Drawing Tools by mphasize · Pull Request #5 · Leaflet/Leaflet.draw. Custom Control with Text Input - No Focus. Documentation - Integration with Leaflet - OSM Buildings. Leaflet integration - How it works with layer control and attributionOpenLayers integration - How it works with layer control and attributionBuilding shadows - These shadows are date and time dependent, according to sun positionGeoJSON - Put custom GeoJSON on the mapDrawing - Create polygons on the map and get them extrudedStyles - Set colors for walls and roofs Prototypes based on OSM Buildings Sketch style - Buildings rendered like drawn by handIndoor Maps - A quick test for turning an SVG floor plan into 3D Selected projects using OSM Buildings. Leaflet/Leaflet.draw. Map leaflet message box. Google street view URL question: jQuery msgBox. How to align input forms in HTML. 203.151.201.129/leaflet/mob-15.html. Css - Best way to center a <div> on a page vertically and horizontally.
Postgis - How to add a polygon from GeoJson into Leaflet. Current community your communities Sign up or log in to customize your list. more stack exchange communities Stack Exchange sign up log in tour help Geographic Information Systems Ask Question Take the 2-minute tour × Geographic Information Systems Stack Exchange is a question and answer site for cartographers, geographers and GIS professionals. OpenLayers, zoom to vector layer extent. It seems quite simple thing to me, but I get an error. After the layer gets successfully loaded, I want to zoom to the vector layer extent: map.zoomToExtent(uses_layer.getDataExtent()); HTML5 Geolocation. Geolocation.getCurrentPosition() - Web API reference. Popup does not have close method. · Issue #1612 · Leaflet/Leaflet. Fight back UTF-8 Invalid Byte Sequences. Chances are, some of you have run into the issue with the invalid byte sequence in UTF-8 error when dealing with user-submitted data.
Leaflet + ajax. Plugins. Warning: regexp match /.../n against to UTF-8 string · Issue #3927 · rails/rails. Leaflet-ajax/dist/leaflet.ajax.js at master · calvinmetcalf/leaflet-ajax. Ajax function to collect geoJSON FeatureCollection and then output popups onto leaflet map layer. Jquery - Leaflet - How to find existing markers, and delete markers. Documentation of how to populate popup contents via ajax · Issue #947 · Leaflet/Leaflet. Jquery - Leaflet - How to find existing markers, and delete markers. Combining Google Maps Geocoder and Leaflet Map Receiving Error: Invalid LatLng object.
Javascript - Creating a Bing and Google Tile Layer for Leaflet. Convert EPS graphics to gif or jpg format, free online tool. Map icon Free vector for free download (about 59 files. HomeFree vectorFree PhotosFree website templatesFree iconFree psdFree footagePS brushesPS PatternsPS StylesFontWallpapers Free vector >> map icon Happy new year 2014 | Fashion | Business card | Backgrounds | Christmas | Sexy | Valentine | Heart | Love | Girl Sort by: Bestmatch first | Recommend first | Popular first | Newest first | Oldest first | Free vector about map icon (about 80 files) Quick Start Guide.
← Tutorials. Quick Start Guide.