
Using Feature Trees to Depict Scope. A feature consists of one or more logically related system capabilities that provide value to a user and are described by a set of functional requirements.
Many business analysts use features as a way to describe the scope of a project. However, a simple list doesn’t readily show the size and complexity of various features. Nor does quickly skimming a feature list easily reveal the full scope of a project. A feature tree is a visual analysis model that organizes a set of features in a format that makes them easy to understand. Feature Tree Format The structure of feature trees is based on fishbone diagrams or Ishikawa diagrams, which are commonly used to organize information into logical groupings based on relationships. A feature tree can show up to three levels of features, commonly called level 1 (L1), level 2 (L2), and level 3 (L3).
Figure 1- Feature tree grouping Each feature is shown on its own line. A Sample Feature Tree Using the Feature Tree Release Planning Functional Decomposition. ExtraHop 4.0 opens up wire data analytics to all IT job functions. Performance management vendor ExtraHop updated its platform to make it accessible to all parts of an IT organization.
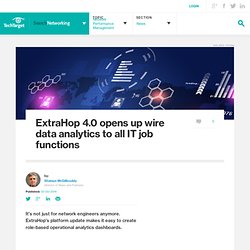
The company is also offering customers longer-term trending capabilities and more customization. ExtraHop's platform collects and analyzes all data that crosses the wire, which means it has the potential to offer insight on any aspect of an IT organization's operations. With its 4.0 release, the company has revamped its user interface to make it easier for new users to create customized views and reports tailored to the technology they are responsible for managing. "The data set that [ExtraHop has] -- wire data -- is all the data that flows over the network," said Bernd Harzog, CEO of APM Experts LLC. "It's the single most comprehensive set of data in the IT industry regarding what's going on in your environment.
The company has also built a new searchable catalog of those metrics so that users can find data points that are relevant to their job function. Next Steps. Www.cisco.com/c/dam/en/us/products/collateral/cloud-systems-management/prime-virtual-network-analysis-module-vnam/at-a-glance-c45-732236.pdf. Nam-matrix-v3.pdf. Introducing the Criteria for the 2015 Network Performance Monitoring and Diagnostics (NPMD) Magic Quadrant.
Jonah Kowall Research Vice President 3.5 years with Gartner 20 years IT industry Jonah Kowall is a research Vice President in Gartner's IT Operations Research group.
He focuses on application performance monitoring (APM), Unified Monitoring, Network Performance Monitoring and Diagnostics (NPMD), Infrastructure Performance Monitoring (IPM), IT Operations Analytics (ITOA), and general application and infrastructure availability and performance monitoring technologies. Read Full Bio Coverage Areas: by Jonah Kowall | August 15, 2014 | 3 Comments Some changes in the upcoming Q1 2015 delivery of the NPMD Magic Quadrant. Thank you, and we look forward to this research deliverable.
Market Definition NPMD tools allow for network engineers to understand the performance of applications and infrastructure components via network instrumentation. Inclusion Criteria Vendors will be required to meet the following criteria to be considered for the 2015 NPMD Magic Quadrant: Network Forensics – For Troubleshooting and CyberSecurity Response. Application Aware Network Performance Monitoring (NPM) and Network Packet Broker (NPB) research. Jonah Kowall Research Vice President 2 years with Gartner 18 years IT industry Jonah Kowall is a research Vice President in Gartner's IT Operations Research group.
VSS-Riverbed-Solution-Brief.pdf. A guide to application performance management. RMON. The Remote Network MONitoring (RMON) MIB was developed by the IETF to support monitoring and protocol analysis of LANs.
The original version (sometimes referred to as RMON1) focused on OSI Layer 1 and Layer 2 information in Ethernet and Token Ring networks. It has been extended by RMON2 which adds support for Network- and Application-layer monitoring and by SMON which adds support for switched networks. It is an industry standard specification that provides much of the functionality offered by proprietary network analyzers. RMON agents are built into many high-end switches and routers. Overview[edit] RMON. Highest Density TAP module. Gigamon manufactures G-TAP® for all Ethernet speeds and media including 10/100/1000 and now 10 Gigabit Ethernet.
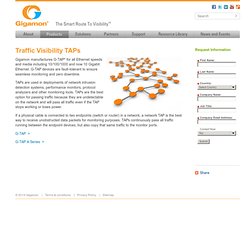
G-TAP devices are fault-tolerant to ensure seamless monitoring and zero downtime. TAPs are used in deployments of network intrusion detection systems, performance monitors, protocol analyzers and other monitoring tools. TAPs are the best option for passing traffic because they are undetectable on the network and will pass all traffic even if the TAP stops working or loses power. If a physical cable is connected to two endpoints (switch or router) in a network, a network TAP is the best way to receive unobstructed data packets for monitoring purposes.
TAPs continuously pass all traffic running between the endpoint devices, but also copy that same traffic to the monitor ports. InfoVista for IP and RF Network Planning, Performance and Optimization. Choosing_Open_Standards_WP_00.pdf. Wp-advantages-multi-vendor-network.pdf. Riverbed Cascade by Riverbed Technology, Inc. - Network Management Software. Simple Network Management Protocol (SNMP) Internetworking Technology Handbook - Network Management Basics [Internetworking]