
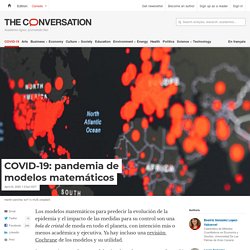
Epidemic Calculator. Coronavirus - ZZ Data Labs. App · Streamlit. COVID-19: pandemia de modelos matemáticos. Los modelos matemáticos para predecir la evolución de la epidemia y el impacto de las medidas para su control son una bola de cristal de moda en todo el planeta, con intención más o menos académica y ejecutiva.
Ya hay incluso una revisión Cochrane de los modelos y su utilidad. The SIR Model for Spread of Disease - Summary. Author(s): David Smith and Lang Moore Explain briefly the modeling steps that lead to the SIR model.

Given a population and disease combination for which the SIR model is appropriate, what are the possible outcomes when a trace of infection is introduced into the population? How can you tell whether there will be an epidemic? Does "epidemic" mean that almost everyone will get the disease? The SIR Model for Spread of Disease - Herd Immunity. Each strain of flu is a disease that confers future immunity on its sufferers.

For such a disease, if almost everyone has had it, then those who have not had it are protected from getting it -- there are not enough susceptibles left in the population to allow an epidemic to get under way. This group protection is called herd immunity. In Part 4 you experimented with the relative sizes of b and k, and you found that, if b is small enough relative to k, then no epidemic can develop.
In the language of Part 5, if the contact number c = b/k is small enough, then there will be no epidemic. But another way to prevent an epidemic is to reduce the initial susceptible population artificially by inoculation. The point of inoculation is to create herd immunity by stimulating in as many people as possible the antibodies that confer immunity -- but without actually giving those people the disease. The SIR Model for Spread of Disease - The Contact Number. In Part 5 we took it for granted that the parameters b and k could be estimated somehow, and therefore it would be possible to generate numerical solutions of the differential equations.

In fact, as we have seen, the fraction k of infecteds recovering in a given day can be estimated from observation of infected individuals. Specifically, k is roughly the reciprocal of the number of days an individual is sick enough to infect others. For many contagious diseases, the infectious time is approximately the same for most infecteds and is known by observation. There is no direct way to observe b, but there is an indirect way. Consider the ratio of b to k: We call this ratio the contact number, and we write c = b/k. Here again are our differential equations for s and i: Use the Chain Rule to explain why The differential equation in step 1 determines (except for dependence on an initial condition) the infected fraction i as a function of the susceptible fraction s.
The SIR Model for Spread of Disease - Euler's Method for Systems. In Part 3, we displayed solutions of an SIR model without any hint of solution formulas.

This suggests the use of a numerical solution method, such as Euler's Method, which we assume you have seen in the context of a single differential equation. Nevertheless, we review the basic idea here. Recall the idea of Euler's Method: If we have a "slope formula," i.e., a way to calculate dy/dt at any point (t,y), then we can generate a sequence of y-values, y0, y1, y2, y3, ... by starting from a given y0 and computing each rise as slope x run. Yn = yn-1 + slopen-1 Delta_t where Delta_t is a suitably small step size in the time domain. The SIR Model for Spread of Disease - Relating Model Parameters to Data. Author(s): David Smith and Lang Moore The infectious period for Hong Kong Flu is known to average about three days, so our estimate of k = 1/3 is probably not far off.

However, our estimate of b was nothing but a guess. Furthermore, a good estimate of the "mixing rate" of the population would surely depend on many characteristics of the population, such as density. In this part, we will experiment with the effects of these parameters on the solutions, and then try to find values that are in agreement with the excess deaths data from New York City. First let's experiment with changes in b. The SIR Model for Spread of Disease - The Differential Equation Model. As the first step in the modeling process, we identify the independent and dependent variables.

The independent variable is time t, measured in days. We consider two related sets of dependent variables. The first set of dependent variables counts people in each of the groups, each as a function of time: The second set of dependent variables represents the fraction of the total population in each of the three categories. Coronavirus Source Data. Data-Driven Prediction of COVID-19 Pandemic End Dates. Qué es el R0, el índice impreciso que pronto podría dar forma a nuestras vidas.
Los dirigentes y los expertos en salud pública de todo el mundo están listos para dedicar los próximos meses o años a obsesionarse con una variable conocida como R0.

Técnicamente pronunciada como “erre subcero”, esta representa el número de nuevas infecciones que se calcula que provienen de un solo caso. Dicho de otro modo, si el R0 de una enfermedad es de 2,5, entonces, se espera que una persona enferma infecte, en promedio, a 2,5 más. Un R0 menor a 1 sugiere que el número de casos se está reduciendo, lo cual podría permitir que ciertas sociedades reanuden sus actividades. Un R0 mayor a 1 indica que el número de casos está aumentando, lo cual tal vez requiera nuevos cierres de emergencia u otras medidas. Sin embargo, el R0 es más complejo de lo que parece. A continuación, una guía simple para entender cómo funciona este índice, por qué es importante y cómo se debe tomar en cuenta. Coronavirus: El factor R y los cuatro parámetros de contagio.
El cada vez más popular factor de reproducción R, o sea el potencial de propagación que tiene un virus.

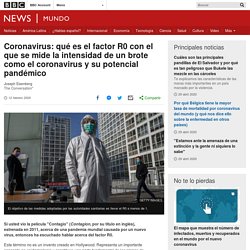
Si el número de reproducción es mayor que 1, cada persona infectada transmite la enfermedad a, al menos, una persona más. Coronavirus: qué es el factor R0 con el que se mide la intensidad de un brote como el coronavirus y su potencial pandémico. Derechos de autor de la imagen Getty Images Si usted vio la película "Contagio" (Contagion, por su título en inglés), estrenada en 2011, acerca de una pandemia mundial causada por un nuevo virus, entonces ha escuchado hablar acerca del factor R0.
Este término no es un invento creado en Hollywood. El número reproductivo básico (R0): consideraciones para su aplicación en la salud póblica.