
Cohen’s d: what standardiser to use? In a previous post we learned about Cohen’s d, a standardized measure of effect size.
In this post we will learn why it is important to consider what value is being used to standardize our effect size. Cohen’s d and the standardiser The basic formula to calculate Cohen’s d is: d = [effect size / relevant standard deviation]. The denominator of the equation is the standardiser and, as mentioned in the previous post, it is important to select the most appropriate standardiser for a given dataset because it can have a big influence on Cohen’s d.
As pointed out by Geoff Cumming and Robert Calin-Jageman in their book Introduction to the New Statistics: Estimation, Open Science, and Beyond, we should ask ourselves if we know the standard deviation associated with the most relevant population for our outcome measure. Standardiser for the studied population The standard deviation calculated from large normative studies will better estimate the standard deviation of the studied population. Summary. Power Analysis and Effect Size Estimation – Mining the Details. Let’s start by going over type I and type II error which occurs in hypothesis testing.
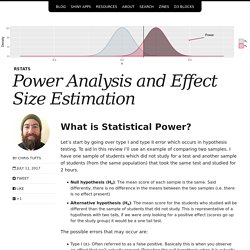
To aid in this review I’ll use an example of comparing two samples. I have one sample of students which did not study for a test and another sample of students (from the same population) that took the same test and studied for 2 hours. Null hypothesis (Ho): The mean score of each sample is the same. Said differently, there is no difference in the means between the two samples (i.e. there is no effect present) Alternative hypothesis (Ha): The mean score for the students who studied will be different than the sample of students that did not study. This is representative of a hypothesis with two tails, if we were only looking for a positive effect (scores go up for the study group) it would be a one tail test.
The possible errors that may occur are: Type I (α)- Often referred to as a false positive. I’m going to focus on type II error for the moment, as this is the one most associated with power. Beyond small, medium, or large: points of consideration when interpreting effect sizes. APA. (2010).
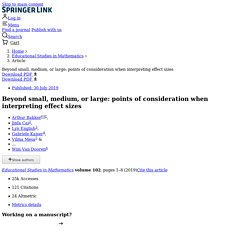
Publication manual of the American Psychological Association (6th ed.). Washington, DC: APA. Google Scholar Baird, M. D., & Pane, J. F. (2019). Fundamentals of estimating sample size - PubMed. Background: Estimating sample size is an integral requirement in the planning stages of quantitative studies.
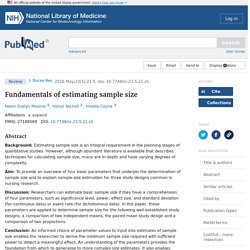
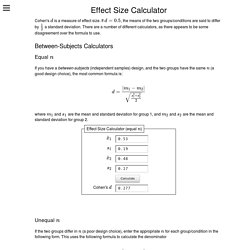
However, although abundant literature is available that describes techniques for calculating sample size, many are in-depth and have varying degrees of complexity. Sample size estimation and power analysis for clinical research studies. Effect Size for One-Way ANOVA. Effect Size for One-Way ANOVA (Jump to: Lecture | Video ) ANOVA tests to see if the means you are comparing are different from one another.
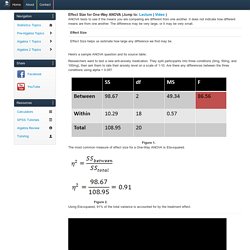
It does not indicate how different means are from one another. The difference may be very large, or it may be very small. Here's a sample ANOVA question and its source table: Researchers want to test a new anti-anxiety medication. Effect Size Calculator. <p style="font-style: italic;">The calculator requires that JavaScript be enabled.
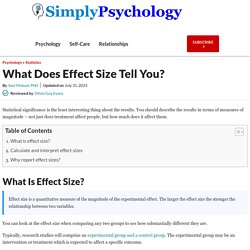
</p> Cohen's is a measure of effect size. If , the means of the two groups/conditions are said to differ by a standard deviation. There are a number of different calculators, as there appears to be some disagreement over the formula to use. Between-Subjects Calculators Equal If you have a between-subjects (independent samples) design, and the two groups have the same (a good design choice), the most common formula is: where and are the mean and standard deviation for group 1, and and are the mean and standard deviation for group 2.
Unequal. What does effect size tell you? What does effect size tell you?
By Saul McLeod, published 2019 Statistical significance is the least interesting thing about the results. You should describe the results in terms of measures of magnitude – not just, does a treatment affect people, but how much does it affect them. Large Samples: Too Much of a Good Thing? The other day I stopped at a fast food joint for the first time in a while.

After I ordered my food, the cashier asked me if I wanted to upgrade to the “Super-Smiley-Savings-Meal” or something like that, and I said, “Sure.” When it came, I was astounded to see the gargantuan soda cup. I don’t know how many ounces it was, but you could have bathed a dachshund in it. If I drank all the Coke that honkin' cup could hold, the megadose of sugar and caffeine would launch me into permanent orbit around Earth.
Effect Size Calculator. 1745691614551642. StatisticsDoneWrong sample ch2. FAQ/effectSize - CBU statistics Wiki. The scales of magnitude are taken from Cohen, J. (1988). Statistical power analysis for the behavioral sciences (2nd ed.). Hillsdale, NJ: Lawrence Erlbaum Associates (see also here). The scales of magnitude for partial are taken from Table 2.2 of Murphy and Myors (2004). FAQ/effectSize - CBU statistics Wiki. Kelley and Preacher Psychological Methods 2012. Using omega-squared instead of eta-squared. Eta-squared (η²) and partial eta-squared (ηp²) are biased effect size estimators.
I knew this, but I never understood how bad it was. Here’s how bad it is: If η² was a flight from New York to Amsterdam, you would end up in Berlin. Because of the bias, using η² or ηp² in power analyses can lead to underpowered studies, because the sample size estimate will be too small. Below, I’ll share a relatively unknown but remarkably easy to use formula to calculate partial omega squared ωp² which you can use in power analyses instead of ηp². You should probably always us ωp² in power analyses. Effect sizes have variance (they vary every time you would perform the same experiment) but they can also have systematic bias. While reading up on this topic, I came across work by Okada (2013). Reporting eta. About eta-squared A measure of relationship; like a correlation coefficient it tells you on a scale 0 to 1 how much of variance in DV can be account for by each IV.
Analogous to r2 and can be thought of as a % on a scale 0-100. It is a useful addition to just being told if a relationship or difference is significant. Eta-squared reflects the percentage of DV variance explained by the IVs in the sample data. As an estimate of variance explained in the population it is upwardly biased (i.e., an overestimate). FAQ/effectSize - CBU statistics Wiki. Generalized eta and omega squared statistics: measures of effect size for some common research designs. Effect Size (ES) - Effect Size Calculators (Lee Becker) MULTIPLE REGRESSION BASICS - MultipleRegressionBasicsCollection.pdf. Power Analysis. Overview Power analysis is an important aspect of experimental design. Power & Sample Size Calculator - Statistical Solutions, LLC. DSS Research: Statistical Power Calculator.
Enter "Test Value" Enter "Sample Average" Enter "Sample Size" Enter "Standard Deviation Value For Sample" "Test Value" and "Sample Average" can not be equal Please enter a value greater than '0' for "Sample Size" Please enter a value greater than '0' for "Standard Deviation for Sample" Please enter valid value for "Test Value" Please enter valid value for "Sample Average" Please enter valid value for "Sample Size" Please enter valid value for "Standard Deviation for Sample" Enter the average value for the sample and a value to compare it to. Also enter the sample size and standard deviation for the sample or rough estimates of them. For reference, a 5-pt. scale may typically have a standard deviation of 0.8 to 1.2 and a 10-pt scale may have a standard deviation between 3.0 and 4.0 for most items.
The larger the standard deviation, the larger the sampling error. Power in Statistics. Power & Sample Size Calculator - Statistical Solutions, LLC. A Comparison of Effect Size Statistics. If you’re in a field that uses Analysis of Variance, you have surely heard that p-values alone don’t indicate the size of an effect. You also need to give some sort of effect size measure. Why? Because with a big enough sample size, any difference in means, no matter how small, can be statistically significant. P-values are designed to tell you if your result is a fluke, not if it’s big. Truly the simplest and most straightforward effect size measure is the difference between two means.
If you’re familiar with an area of research and the variables used in that area, you should know if a 3-point difference is big or small, although your readers may not. How to calculate Cohen d effect size. Estimating the Sample Size. Estimating the Sample Size Necessary to Have Enough Power How much data do you need -- that is, how many subjects should you include in your research. If you do not consider the expenses of gathering and analyzing the data (including any expenses incurred by the subjects), the answer to this question is very simple -- the more data the better.
The more data you have, the more likely you are to reach a correct decision and the less error there will be in your estimates of parameters of interest. The ideal would be to have data on the entire population of interest. In that case you would be able to make your conclusions with absolute confidence (barring any errors in the computation of the descriptive statistics) and you would not need any inferential statistics. Effect size used in power analysis? University of Colorado Colorado Springs.
Free Effect Size (Cohen's d) Calculator for a Student t-Test. Effect Size for Dependent Samples t-Test. Effect Size for Paired T-test. University of Colorado Colorado Springs. Eta-Squared. Eta-squared. Meta-analysis Workshop - ma-hebrew.pdf. Effect sizes. Null hypothesis testing and effect sizes Most of the statistics you have covered have been concerned with null hypothesis testing: assessing the likelihood that any effect you have seen in your data, such as a correlation or a difference in means between groups, may have occurred by chance.
As we have seen, we do this by calculating a p value -- the probability of your null hypothesis being correct; that is, p gives the probability of seeing what you have seen in your data by chance alone.