
Machine Learning and Probabilistic Graphical Models: Course Materials. Graphical Models. By Kevin Murphy, 1998.
"Graphical models are a marriage between probability theory and graph theory. They provide a natural tool for dealing with two problems that occur throughout applied mathematics and engineering -- uncertainty and complexity -- and in particular they are playing an increasingly important role in the design and analysis of machine learning algorithms. Fundamental to the idea of a graphical model is the notion of modularity -- a complex system is built by combining simpler parts.
Probability theory provides the glue whereby the parts are combined, ensuring that the system as a whole is consistent, and providing ways to interface models to data. The graph theoretic side of graphical models provides both an intuitively appealing interface by which humans can model highly-interacting sets of variables as well as a data structure that lends itself naturally to the design of efficient general-purpose algorithms.
This tutorial We will briefly discuss the following topics. Judea Pearl. Judea Pearl (born 1936) is an Israeli-born American computer scientist and philosopher, best known for championing the probabilistic approach to artificial intelligence and the development of Bayesian networks (see the article on belief propagation).
He is also credited for developing a theory of causal and counterfactual inference based on structural models (see article on causality). He is the 2011 winner of the ACM Turing Award, the highest distinction in computer science, "for fundamental contributions to artificial intelligence through the development of a calculus for probabilistic and causal reasoning".[1][2][3][4] Judea Pearl is the father of journalist Daniel Pearl, who was kidnapped and murdered by militants in Pakistan connected with Al-Qaeda and the International Islamic Front in 2002 for his American and Jewish heritage.[5][6] Biography[edit] Pearl is currently a professor of computer science and statistics and director of the Cognitive Systems Laboratory at UCLA. Books[edit] Converted document. \pagenumberingarabic A probabilistic graphical model (PGM) consists of a probability distribution, defined on a set of variables, and a graph, such that each node in the graph represents a variable and the graph represents (some of) the independencies of the probability distribution.
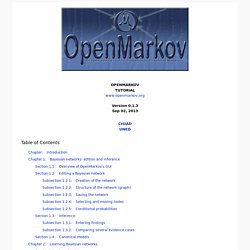
Some PGMs, such as Bayesian networks [1], are purely probabilistic, while others, such as influence diagrams [2], include decisions and utilities. OpenMarkov (see www.openmarkov.org) is an open source software tool developed at the Research Center on Intelligent Decision-Support Systems (CISIAD) of the Universidad Nacional de Educación a Distancia (UNED), in Madrid, Spain. This tutorial explains how to edit and evaluate PGMs using OpenMarkov. It assumes that the reader is familiar with PGMs. In this tutorial different fonts are used for different purposes: Sans Serif is used for the elements of OpenMarkov’s graphical user interface (the menu bar, the network window, the OK button, the Options dialog...). SamIam - Sensitivity Analysis, Modeling, Inference and More.
SamIam User Documentation. JavaBayes 0.346 - User Manual and Download. Converted document. Bayesian Networks and Bayesian Classifier Software. Software Packages for Graphical Models. Interactive_learning.pdf. SamIam - Sensitivity Analysis, Modeling, Inference and More. Bayesian networks and influence diagrams. Il Sito della Medicina di Laboratorio. ECPEDM. Causality for Policy Assessment and Impact Analysis. Stefan ConradyManaging Partner, Bayesia USA Dr.

Lionel JouffeCEO, Bayesia S.A.S. Recorded on November 18, 2014, at George Mason University Arlington CampusRuntime: 01:52:24 The objective of this presentation is to provide a practical framework for causal effect estimation with non-experimental data. We will present a range of methods, including Directed Acyclic Graphs and Bayesian networks, which can help distinguish causation from association when working with data from observational studies. This talk is a "live" version of a recent tutorial, Causality for Policy Assessment and Impact Analysis - Directed Acyclic Graphs and Bayesian Networks for Causal Identification and Estimation. The next workshop on the this topic will be hosted on February 3, 2015, at the North Carolina Biotechnology Center in Durham, NC.
BayesiaLab 5.3 - Bayesian Networks for Research and Analytics. Bayesia USA. Bayesian Cognitive Modeling. Reti_Bayesiane. Discovering Structure in Data with Bayesian Nonparametrics. Lab & Bayesian Networks.