
INFRARED SPECTROSCOPY. Home of Pittcon 2011 - Laboratory Science Equipment Conference and Exposition. Process Analytical Technology - PAT Resource, Raman, NIR, UV, PAT Jobs. Romero-TorresMar2010.pdf (application/pdf Object) Process Analytical Technology – Application of Near IR Spectroscopy in Pharmaceutical Processes. Reaction Progression, Kinetics, and Mechanism Elucidation - METTLER TOLEDO - United States.
Introducing PAT, Using NIR Analysis, to a Pharmaceutical Blending Process. FDA. Pharmaceutical cGMPs for the 21st Century: A Risk-Based Approach Comments on this report should be submitted to the Dockets Management Branch (HFA-305), Food and Drug Administration, 5630 Fishers Lane, rm. 1061, Rockville, MD 20852.
All comments should be identified with Docket Number 03N-0059. Electronic Management Comment Form: Docket 03N-0059 - Pharmaceutical Current Good Manufacturing Practices for the 21st Century: A Risk-Based Approach The FDA’s Process Analytical Technology (PAT) initiative is an effort to facilitate the introduction of new manufacturing technologies in the pharmaceutical industry for achieving more efficient processes. Process Analytical Technologies are systems that enhance process understanding and assist in identifying and controlling critical points in a process. Process analytical technology. Process analytical technology (PAT) has been defined by the United States Food and Drug Administration (FDA) as a mechanism to design, analyze, and control pharmaceutical manufacturing processes through the measurement of Critical Process Parameters (CPP) which affect Critical Quality Attributes (CQA).
The concept actually aims at understanding the processes by defining their CPPs, and accordingly monitoring them in a timely manner (preferably in-line or on-line) and thus being more efficient in testing while at the same time reducing over-processing, enhancing consistency and minimizing rejects. The FDA has outlined a regulatory framework[1] for PAT implementation. With this framework – according to Hinz[2] – the FDA tries to motivate the pharmaceutical industry to improve the production process. Infrared - Your Guide to IR, FTIR and NIR spectroscopy. Fourier transform infrared spectroscopy. The term Fourier transform infrared spectroscopy originates from the fact that a Fourier transform (a mathematical process) is required to convert the raw data into the actual spectrum.
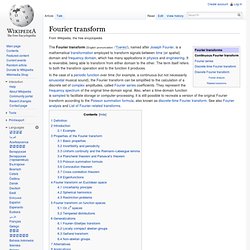
For other uses of this kind of technique, see Fourier transform spectroscopy. Conceptual introduction[edit] Infrared. A false color image of two people taken in long-wavelength infrared (body-temperature thermal) light.
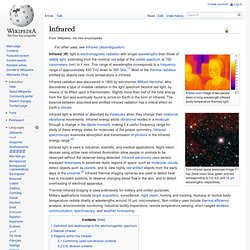
This infrared space telescope image has (false color) blue, green and red corresponding to 3.4, 4.6, and 12 µm wavelengths, respectively. Infrared (IR) light is electromagnetic radiation with longer wavelengths than those of visible light, extending from the nominal red edge of the visible spectrum at 700 nanometers (nm) to 1 mm. This range of wavelengths corresponds to a frequency range of approximately 430 THz down to 300 GHz.[1] Most of the thermal radiation emitted by objects near room temperature is infrared.
Infrared radiation was discovered in 1800 by astronomer William Herschel, who discovered a type of invisible radiation in the light spectrum beyond red light, by means of its effect upon a thermometer. Slightly more than half of the total energy from the Sun was eventually found to arrive on Earth in the form of infrared. Infrared in relation to Electromagnetic spectrum. Absorption (electromagnetic radiation) An overview of electromagnetic radiation absorption.
This example discusses the general principle using visible light as specific example. Electromagnetic spectrum. The electromagnetic spectrum is the range of all possible frequencies of electromagnetic radiation.[4] The "electromagnetic spectrum" of an object has a different meaning, and is instead the characteristic distribution of electromagnetic radiation emitted or absorbed by that particular object.
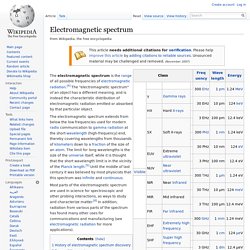
Most parts of the electromagnetic spectrum are used in science for spectroscopic and other probing interactions, as ways to study and characterize matter.[6] In addition, radiation from various parts of the spectrum has found many other uses for communications and manufacturing (see electromagnetic radiation for more applications). History of electromagnetic spectrum discovery. Raman scattering. Raman scattering or the Raman effect /ˈrɑːmən/ is the inelastic scattering of a photon.
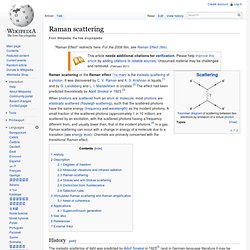
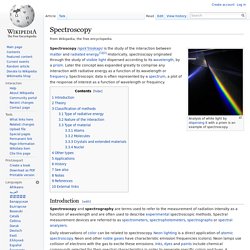
It was discovered by C. V. Raman and K. S. Measuring Light with Wavelengths and Wavenumbers. Raman spectroscopy. Energy-level diagram showing the states involved in Raman signal.
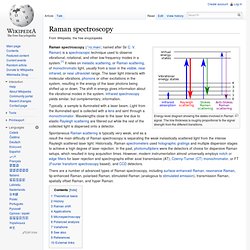
The line thickness is roughly proportional to the signal strength from the different transitions. Raman spectroscopy (/ˈrɑːmən/; named after Sir C. V. Raman) is a spectroscopic technique used to observe vibrational, rotational, and other low-frequency modes in a system.[1] It relies on inelastic scattering, or Raman scattering, of monochromatic light, usually from a laser in the visible, near infrared, or near ultraviolet range. The laser light interacts with molecular vibrations, phonons or other excitations in the system, resulting in the energy of the laser photons being shifted up or down. Spontaneous Raman scattering is typically very weak, and as a result the main difficulty of Raman spectroscopy is separating the weak inelastically scattered light from the intense Rayleigh scattered laser light. Theoretical basis[edit] History[edit] Fourier transform. Definition[edit] There are several common conventions for defining the Fourier transform of an integrable function (Kaiser 1994, p. 29), (Rahman 2011, p. 11).
This article will use the following definition: Spectroscopy. Introduction[edit] Spectroscopy and spectrography are terms used to refer to the measurement of radiation intensity as a function of wavelength and are often used to describe experimental spectroscopic methods.
Spectral measurement devices are referred to as spectrometers, spectrophotometers, spectrographs or spectral analyzers. ExpoTech. Welcome to IFPAC. Wired Equivalent Privacy. Wired Equivalent Privacy (WEP) is an easily broken security algorithm for IEEE 802.11 wireless networks. Introduced as part of the original 802.11 standard ratified in September 1999, its intention was to provide data confidentiality comparable to that of a traditional wired network.[1] WEP, recognizable by the key of 10 or 26 hexadecimal digits, was at one time widely in use and was often the first security choice presented to users by router configuration tools.[2][3] Although its name implies that it is as secure as a wired connection, WEP has been demonstrated to have numerous flaws and has been deprecated in favour of newer standards such as WPA2.
In 2003 the Wi-Fi Alliance announced that WEP had been superseded by Wi-Fi Protected Access (WPA). Summer Rd, Thames Ditton, Surrey, KT7, UK - Google Maps. 4041 Forest Park Ave, St Louis, MO 63108 - Google Maps. Advanced PAT Applications. InPhotonics: Makers of the RamanProbe(TM) and other quality Raman products. FOSS NIR Analyzer - Foss NIRSystems, Inc. NIR. Michelson interferometer. Figure 1. A Michelson interferometer for use on an optical table. The Michelson interferometer is the most common configuration for optical interferometry and was invented by Albert Abraham Michelson. Optical fiber connector. LC and ST optical fiber connectors An optical fiber connector terminates the end of an optical fiber, and enables quicker connection and disconnection than splicing.
The connectors mechanically couple and align the cores of fibers so light can pass. Better connectors lose very little light due to reflection or misalignment of the fibers. In all, about 100 fiber optic connectors have been introduced to the market.[1] Application[edit] Optical fiber connectors are used to join optical fibers where a connect/disconnect capability is required. Optical fiber connectors are used in telephone company central offices, at installations on customer premises, and in outside plant applications to connect equipment and cables, or to cross-connect cables.
Axsun Technologies.