
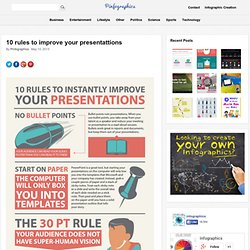
10 rules to improve your presentattions. 135 Flares Twitter 52 Facebook 65 Google+ 18 Pin It Share 0 3K+ 135 Flares × 10 rules to improve your presentattions.
Education - 13 Types of Graphs. Graphs and charts are used to for easy and precise presentation of complex data.
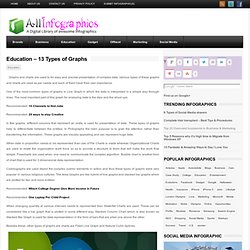
Various types of these graphs and charts are used as per needs and each of them have their own importance. One of the most common types of graphs is Line Graph in which the data is interpreted in a simple way through lines. The most important part of this graph for analyzing data is the dips and the shoot ups. Recommended: 10 Channels to find Jobs Recommended: 29 ways to stay Creative. Datavisualisation. Rules. 10 sites pour créer une infographie. Why use infographics. The Art of Color Coordination. Colors affect us in countless ways—mentally and physically, consciously and subconsciously. Psychologists have suggested that color impression can account for 60% of the acceptance or rejection of a product or service. Good color choices should never be neglected in web design.
A bad color combination can have the same negative effect as poor copy and slow load times. In this infographic, we will briefly discuss color coordination and how you can use this to your advantage when designing your site. Type Guide. Color Emotion Guide. 5 Things That Waste Your Time at Work. Aside from the time you purposefully waste at work — checking Facebook or playing Draw Something, as the kids do — there's a lot of other stuff that can slow you down at the office.
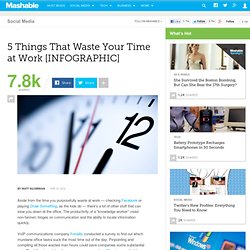
The productivity of a "knowledge worker" (read: non-farmer) hinges on communication and the ability to locate information quickly. VoIP communications company Fonality conducted a survey to find out which mundane office tasks suck the most time out of the day. Pinpointing and compiling all those wasted man hours could save companies some substantial coin.
The folks at social performance management tool Rypple compiled the infographic below based on that data. The top time stealer? Marketing Matrix for Small Businesses. Entrepreneurs facts & figures. Social Media Distracts You. How often does the social media monster swallow you whole?
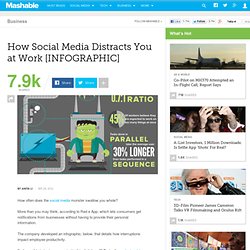
More than you may think, according to Red e App, which lets consumers get notifications from businesses without having to provide their personal information. The company developed an infographic, below, that details how interruptions impact employee productivity. "Is it possible to be too connected in this digital age? " Red e App asks in a blog post. "Research data indicates, yes. " Small Business, Social Media, Effective Growth. The Success of Small business these days is rightly measured upon how they look at their business and what steps they take to make it a high pitch volume sales all through the day.
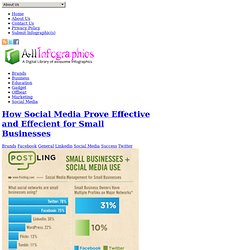
However, one of the most particular reason why lot of small business are succeeding, its because of the fact that they are concentrating lot on social media these days. They’ve focused on getting more followers, likes and views to reach more potential customers. Desk and productivity. Manage Stress. Sleeping for about an hour in the day can reduce average blood pressure following mental stress. Research exploring the outcome of a daytime nap on cardiovascular recovery after a stress test, revealed that those individuals who slept not less than 45 minutes in the course of the day had reduced average blood pressure after psychological stress than individuals who didn’t sleep. Read the full story here: Daytime Nap Lowers Average Blood Pressure after Mental Stress Manage Stress Infographic Manage Stress Infographic by BetterWorks Signing you up! Get the Health Blog News Letter Delivered to Your Inbox!
Money tips for teens. What would happen if the world only had 100 people? Anatomy of a Teacher. Heart disease stats. iT guys. EQUALITY. Why We Can't Get Enough TED Talks. Solar-eclipses. Emergency Room. Share this infographic on your site!
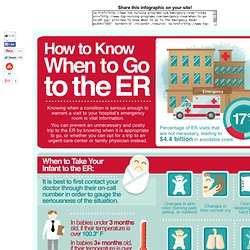
<a href=" src=" alt="How To Know When To Go To The Emergency Room" width="500" border="0" /></a><br />Source: <a href=" Nursing Programs</a> Embed this infographic on your site! Knowing when a condition is serious enough to warrant a visit to your hospital's emergency room is vital information. Music lessons. Music Learning. The History of Film. TIE DIY. Rock-paper-scissors. Table etiquette. Blueberries. With just 80 calories per cup and virtually no fat, blueberries offer many noteworthy nutritional benefits.
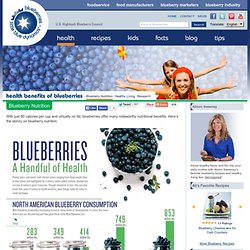
Here’s the skinny on blueberry nutrition: Vea este inforgraphic Español Blueberries are packed with vitamin C. In just one serving, you can get 14 mg of Vitamin C – almost 25 percent of your daily requirement. Vitamin C aids the formation of collagen and helps maintain healthy gums and capillaries. Blueberries are dynamos of dietary fiber. Research has shown that most of us don’t get enough fiber in our diets. Blueberries are an excellent source of manganese. Manganese plays an important role in bone development and in converting the proteins, carbohydrates and fats in food into to energy – a perfect job for blueberries3. Blueberries contain substances that have antioxidant properties Antioxidants work to neutralize free radicals — unstable molecules linked to the development of cancer, cardiovascular disease and other age-related conditions such as Alzheimer’s.
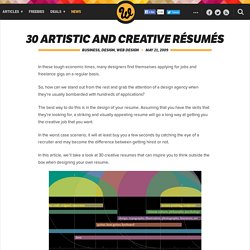
Fat. Cards Against Humanity. Workout nutrition. 30 Artistic and Creative Résumés. In these tough economic times, many designers find themselves applying for jobs and freelance gigs on a regular basis.
Mobile phone usage report 2011. Mobile Phone when Driving. As part of our Kill the Conversation campaign, we have put together the following infographic on the dangers of using mobile phones while driving.
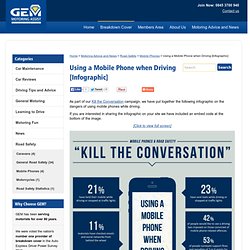
If you are interested in sharing the infographic on your site we have included an embed code at the bottom of the image. [Click to view full screen] Share this infographic on your site by using the embed code below: In bed w. Tech. It’s remarkably easy to fall into the trap of using your phone or ipod to get those last minute Facebook statuses or pop Netflix on to help you fall asleep.
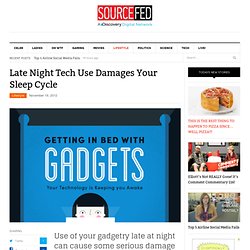
The routine is fairly normal, since 95% of people say that they browse the web, text, or watch TV just before going to sleep and drifting off into lala land. However, all that time spent with your tech does a lot more than just distract you. It can make it very difficult for you to fully fall asleep when you finally close your eyes. According to the info-graphic below, your tech is damaging your sleep cycle. Nation. Apple Tree. When it comes to industrial design, few consumer electronics or computer makers have the legacy or influence of Apple, Inc. In the last 35 years, Apple has introduced a myriad of products and devices, some very successful, some, not so much. Artist Mike Vasilev created this infographic for Mashable, highlighting the major Apple product releases and design changes from 1976 through 2011.
With rumors of the iPhone 5, iPhone 6 and a smaller, lower-cost iPhone all spreading through the technosphere, we feel certain that at least one more item will be added to the "redesign" list before 2011 closes out. Infographics Marketing Tools. In our “Ultimate Guide to Marketing With Infographics” we covered all the ways you can leverage them to extend their reach (rather than letting them simply appear once in a blog post and fade away). It covered: Creation vs. curationResearching data sourcesEmbed codes for easy sharingVirality using social recycling via a landing pageMaking them Pinnable with PinterestA PDF and much more… Today we’ll dig into the stats behind why infographics are so effective as a marketing tool. As you’ll notice from the graphic above, people are searching for infographics like crazy! An 800% increase in searches on Google in just the last two years. The Joy of Clicking. Google Tips and Tricks. Online tracking. How_to_research_infographic.jpg.
Password.