
MindMup: Zero-Friction Free Online Mind Mapping Software - Mind Map in the cloud. This operation requires a valid MindMup Gold License.

To export, save, publish and embed larger maps using MindMup Gold, please log in or sign up for a Gold account. Enter your e-mail or account name and we'll send you a one-time password. We have sent a temporary access code to your e-mail. Please wait, your license is being restored We could not find that email or username. If you are a new user select Sign up, or go Back to provide a different email. Please wait, sending the access code to your e-mail The code you entered was rejected. If you think this is an error, please email us at contact@mindmup.com This operation is not authorised under your current MindMup Gold License. Click on Log Out to change the active license in this browser or View Subscription to see your subscription details and renew it. If you think that this is an error, please send us an e-mail at contact@mindmup.com This license is invalid or expired Click on Log Out to change the active license in this browser.
Excel Charts. Create a Chart | Change Chart Type | Switch Row/Column | Chart Title | Legend Position | Data Labels A simple chart in Excel can say more than a sheet full of numbers.
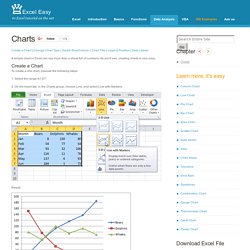
As you'll see, creating charts is very easy. Best Online Courses.
The 99 best infographics. Every picture tells a story, as they say, but sometimes it takes a clever combination of words and pictures to tell a story quickly, concisely and in an entertaining fashion. The best infographics may look like they were simple to create in Photoshop, but designing an effective piece of data visualization is usually anything but. There are several great tools to create infographics, but these examples of infographics from around the web will show you how you can take it a step further and add a bit of style and personality to your data. Some are older than others, but they can still provide some inspiration for those of you looking to create an infographic from scratch. Some are funny, some more serious, and all are inspiring examples of the art. If Star Wars: The Last Jedi has put you in the mood to immediately watch the original movie, hold your horses just one second. 02. 03.
Are you reading this slumped at your desk? 04. Do you know your aperture from your apex? 10 free tools for creating infographics. Done right, infographics can be a great way to make sense of complex data.
The best infographics transform complex information and data into graphics that are both easy to grasp and visually appealing. The only problem is, infographics that look like they were simple to make are often anything but. Exclusive offer: Save 15% on Adobe Creative Cloud now Here, we've selected our top free tools and apps for making infographics. Some of the options here are even suitable for non-designers, as templates and other features make them easy to use. Give these free tools a try and let us know which ones you get on best with on Facebook or Twitter. The 38 best tools for data visualization. It's often said that data is the new world currency, and the web is the exchange bureau through which it's traded.
As consumers, we're positively swimming in data; it's everywhere from labels on food packaging design to World Health Organisation reports. As a result, for the designer it's becoming increasingly difficult to present data in a way that stands out from the mass of competing data streams. Get Adobe Creative Cloud One of the best ways to get your message across is to use a visualization to quickly draw attention to the key messages, and by presenting data visually it's also possible to uncover surprising patterns and observations that wouldn't be apparent from looking at stats alone. And nowadays, there's plenty of free graphic design software to help you do just that. As author, data journalist and information designer David McCandless said in his TED talk: "By visualizing information, we turn it into a landscape that you can explore with your eyes, a sort of information map. Infographics & Data Visualization.
For Dummies search "data visualization" For Dummies search "The Infographic World Team" Create and share visual ideas online. Free Data Visualization Software. Infographics For Dummies Cheat Sheet. Infographic designers have some basic tools — from design software to online sites and services — that help them create effective infographics.
Here are some basic needs for any infographic design toolbox. Professional designers need to invest in one or both of the big guns in infographic design: Adobe Illustrator or Adobe Photoshop. If just beginning to test the infographic waters, a designer should take advantage of a few free or low-cost options. Infographics can be created easily and effectively with: Microsoft’s PowerPoint or Publisher An infographic design-and-share site, such as infogr.am.
When working with a client, always ask to see what resources they are willing to share or lend you. Visual Capitalist.