
Infographic Journal - The Best Infographics in One Place. 17 visualisation tools to make your data beautiful. You don’t need to be a seasoned data scientist or have a degree in graphic design in order to create incredible data visualisations.
It has become a lot simpler to mine your data and interpret your insights in an engaging, attractive, and most importantly easy to understand way. This is a list of various different free and premium tools and platforms available which will allow you to communicate data in a variety of different formats, from interactive charts, to infographics, to maps, to word clouds. Not all will be suitable for your particular data set or your audience, but its certainly worth experimenting with a few to seek out the most relevant. Hopefully you’ll not only learn some new skills and find some new creative tools, but also learn something about your own data.
Infogr.am At Infogr.am you can create interactive, embeddable infographics using more than 30 charts and six themes. Fusion Tables Piktochart dygraphs Timeline Leaflet Tagxedo Tagxedo is a simple to use word cloud generator. 8 Ways to Engage eLearners Infographic. E-Learning Infographics 8 Ways to Engage eLearners Infographic 8 Ways to Engage eLearners Infographic Do you struggle to engage your staff through e-learning?
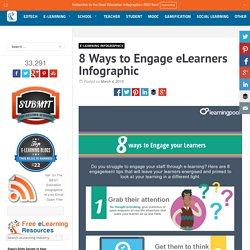
The 8 Ways to Engage eLearners Infographic provides 8 engagement tips that will leave your learners energised and primed to look at your learning in a different light. How to Engage eLearners: Grab their attention. Be thought provoking, give statistics or quick snippets of real life situations that make your learner sit up and think. Get them to think Use οpen input questions giving the learner time to think about what they already know & what they are unsure of. 17 Fantastic Infographic Generators! Data is crucial.

However, displaying a chunk of plain data can be monotonous. Infographics visualize plain data and make it visually more appealing. Data turned into infographic has a higher potential to go viral and be effective. While many of us are designers who can design amazing infographs, Infographic Generators can come in handy to Designers and non-designers alike. They can be a time saving resource. Piktochart. Links to Infographic Sites, Visual Designers and C - Cool Infographics. Randy's infographic design consultancy to Visualize Business Intelligence Jacob O'Neal's site focused on designing animated GIF infographics Company that helps visualize business data Rose Zgodzinski's site to help client find visual solutions Consulting, Design and Social + PR Brian Cragin is an infographic designer in San Diego A masterfully constructed infographic campaign can work wonders for your business Dashboard Design: Data Driven helps your clients better understand and act upon your information Dejure Design provides interactive and visual design services to social justice organizations seeking to make their legal work more accessible and engaging.
One of the UK’s leading providers of infographics and data visualisation for bloggers and businesses of all sizes An interactive design industry We make important data beautiful and easy to understand We specialize in transmitting messages in a clear, simple and attractive way. Tools - Cool Infographics. Adioma creates information graphics out of your textual data, using timelines, grids and icons.
Create impressive charts from spreadsheets. Assemble into dashboards, embed in websites, or simply share a link. A Python interactive visualization library that targets modern web browsers for presentation Cacoo is a free online drawing tool that allows you to create a variety of diagrams such as site map, flowchart, mind map, wire frame, UML diagram and network diagram. Crowdsourced Analytics Solution Marketplace - Make Sense of Big Data Free interactive charts created online in seconds ChartGo is an online graph maker tool.
10 free tools for creating infographics. Done right, infographics can be a great way to make sense of complex data.
The best infographics transform complex information and data into graphics that are both easy to grasp and visually appealing. The only problem is, infographics that look like they were simple to make are often anything but. Exclusive offer: Save 15% on Adobe Creative Cloud now Here, we've selected our top free tools and apps for making infographics. Some of the options here are even suitable for non-designers, as templates and other features make them easy to use. Give these free tools a try and let us know which ones you get on best with on Facebook or Twitter. 01. Visme promises to help you 'speak visually'. 02. Canva is a powerful and easy-to-use online tool that's suitable for all manner of design tasks, from brochures to presentations and much more besides. 03. Google's chart tools are powerful, simple to use, and free.