
ChartAccent. These Infographics Will Teach You All About Super Mario. Is there a more popular video game character than Mario?
Nintendo’s plumber has seen and done it all in the gaming world, and he shows no signs of slowing down! Today, we’re going to take a look 3 different Super Mario infographics that’ll fill your head with all kinds of information. You’ll be an expert! First, we have a quick look at Mario’s history told through a family tree. It’s a fascinating way to learn where he came from! Via RetroNick. Media Make #3: Argue with Images! Infographics. Create an infographic to represent the key data around an election issue that matters to you.
Share it on Instagram and Twitter: #MediaMakeInfographic and #2NextPrez What is an Infographic? Infographics use visuals to make statistics or processes easier to understand. They enhance the meaning of data, allowing us to see patterns amidst large quantities of information. Journalists use infographics to tell a deeper story about current events. There are many ways to visualize your data. Pie Chart A circular chart divided into sectors, with each sector showing the relative size of each value. Good for: Percents in general, demographics, polling data, etc. How to Make an Infographic for Free with PowerPoint.
Untitled. So, You Want to be a Graphic Designer? Do you want to be a graphic designer?
Designing images can be quite the rewarding career, as it gives you a chance to flex those creative muscles and make something you can show off to the world. Of course, it’s not a job you can just jump into, and you need some training and skills in order to actually be successful. You also need some tools.
Every graphics designer has their kit of things they need to be successful at work. Whether it’s their phone, computer, or software, there are a few things they all require. Via TheNewMedia. 3 SlideShares to Read Before Creating Your Next Infographic. Infographics have taken off.
In today’s world of information overload, infographics’ visual focus make them more persuasive, engaging, and memorable than text alone. The numbers prove it: Publishers who use infographics increase their website traffic by 12 percent more than those who don’t. And infographics on SlideShare get more engagement that presentations, documents or videos. For a thorough understanding of what makes a successful infographic — and how to make them work for you — check out the following SlideShares. It’s All About Infographics Infographics may seem like a recent trend, but in reality, they have been around since caveman times. 9 Curious Wedding Traditions From Around the World.
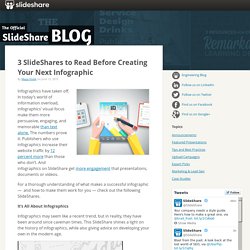
How Often People in Various Countries Shower. Cleanliness, it turns out, has been one dirty trick.
One reason early-20th-century Americans ramped up their weekly baths to daily showers is that marketing companies capitalized on the insecurities of a new class of office drones working in close quarters. As Gizmodo wrote last week, to sell products like "toilet soap" and Listerine to Americans, "the advertising industry had to create pseudoscientific maladies like 'bad breath' and 'body odor.'" Take, for instance, Gizmodo's description of the philosophy of the Cleanliness Institute, which was founded by the Association of American Soap and Glycerine Producers: The trade association wanted Americans to to wash quite unwittingly after toilet, to wash without thought before eating, to jump into the tub as automatically as one might awake each new day. And so we did. Showers Per Week Now is the dawn of a new, more pungent era, though.
A Euromonitor poll from July found that Americans are fairly average when it comes to hygiene. National Geographic. Our World in Data — Visualising the Empirical Evidence on how the World is Changing. What the World Eats. Pinterest: Discover and save creative ideas. Infographic For World Water Day (March 22nd) Dining Etiquette Around The World. Creator. Processing ...

Personal $ Svg $20 ✓ Up to $75 merchandises for personal use. Merchandise $ License to use artwork in merchandises (T-Shirt, Mug, poster, etc). Single Use $ License for single-purpose non-merchandising use. Unlimited $ Unlimited personal or commercial use. Custom $TBD Custom license, with terms subject to prior arrangement. Please contact licensing@tagxedo.com for more information By accepting this license, you agree to the Tagxedo's Terms of Service, and you agree that you have acquired the right to use the source image to create the Tagxedo artwork, and that you indemnify and hold harmless Tagxedo and its employees and officers from any harm are liability that may incur. Please contact licensing@tagxedo.com if you have any question. Infographics Archive - Page 3 of 5. Infopacket: Bill of Rights Primer Get eight packed pages of historical context and easy-to-understand explanations of the first ten Constitutional Amendments in this FREE Bill of ...
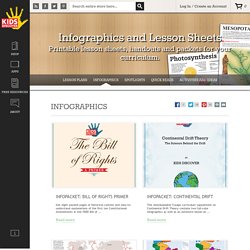
Read more Infopacket: Continental Drift This downloadable 5-page curriculum supplement on Continental Drift Theory contains two full-color infographics as well as an extensive lesson on ... Read more Infographic: Plate Tectonics Illustrate the concept of plate tectonics for kids with this detailed full-color infographic.