
Quick-R: Home Page. Rseek.org. Statistical Computing. R site search. Financial Risk Modelling and Portfolio Optimization with R. Introduces the latest techniques advocated for measuring financial market risk and portfolio optimisation, and provides a plethora of R code examples that enable the reader to replicate the results featured throughout the book.
Recommendation System in R. Recommender systems are used to predict the best products to offer to customers.
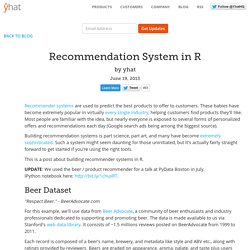
These babies have become extremely popular in virtually every single industry, helping customers find products they'll like. Most people are familiar with the idea, but nearly everyone is exposed to several forms of personalized offers and recommendations each day (Google search ads being among the biggest source).
Building recommendation systems is part science, part art, and many have become extremely sophisticated. Such a system might seem daunting for those uninitiated, but it's actually fairly straight forward to get started if you're using the right tools. Tutorial: Building 'Shiny' Applications with R. Shiny is a new package from RStudio that makes it incredibly easy to build interactive web applications with R.
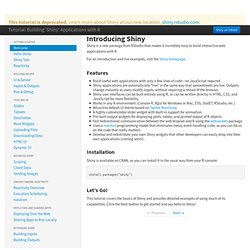
For an introduction and live examples, visit the Shiny homepage. Features Build useful web applications with only a few lines of code—no JavaScript required. Shiny applications are automatically “live” in the same way that spreadsheets are live. Outputs change instantly as users modify inputs, without requiring a reload of the browser. Installation Shiny is available on CRAN, so you can install it in the usual way from your R console: install.packages("shiny")
Why I want to write nice R code - Nice R Code. Writing code is fast becoming a key - if not the most important - skill for doing research in the 21st century.
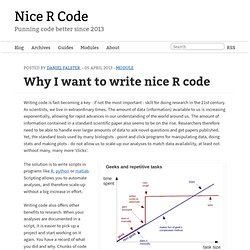
As scientists, we live in extraordinary times. The amount of data (information) available to us is increasing exponentially, allowing for rapid advances in our understanding of the world around us. The amount of information contained in a standard scientific paper also seems to be on the rise. Togaware: One Page R: A Survival Guide to Data Science with R.
Social Networks in R - Daizaburo Shizuka. High scale in-database modeling in Greenplum with R. gRaphical Models in R. Wikipedia defines a graphical model as follows: A graphical model is a probabilistic model for which a graph denotes the conditional independence structure between random variables.
Package data.table. Taking R to the Limit (High Performance Computing in R), Part 1. Taking R to the Limit (High Performance Computing in R), Part 2. 20 R Packages That Should Impact Every Data Scientist « Data Scientist Insights. 100 most read R posts for 2012 (stats from R-bloggers) – big data, visualization, data manipulation, and other languages. R-bloggers.com is now three years young.
The site is an (unofficial) online journal of the R statistical programming environment, written by bloggers who agreed to contribute their R articles to the site. Last year, I posted on the top 24 R posts of 2011. Top 6 reasons you need to be using RStudio. RStudio is an awesome tool that can help you do your work better and faster.
In technical terms, RStudio is a cross-platform integrated development environment (IDE) for the R statistical language. If you aren't a programmer type, that description may not mean much to you, and so maybe you think that means you shouldn't be using it. 10 R Packages Every Data Scientist Should Know About. Computational Cognitive Science Lab. In late 2013 I gave a one-day workshop out at CSIRO that aimed to provide a brief introduction to R for an audience who knew statistics but not R.
The workshop consisted of two distinct parts, an introduction to the basic mechanics of R, followed by a fairly rapid coverage of a lot of core statistical tools in R. (There's also a bonus "Part 3" that covers a few additional topics that I'm fond of). Anyway, given that the University owns the IP associated with the workshop, and with the agreement of both CSIRO and the University, I've posted copies of all the slides, the exercises and the solution sets to the exercises.
I also had the presence of mind to record screencasts of my practice talk, so there's about 5 hours of me talking about statistics linked to below! Two warnings about the videos. Welcome. I started using R about 3 years ago.
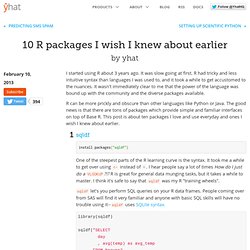
It was slow going at first. R had tricky and less intuitive syntax than languages I was used to, and it took a while to get accustomed to the nuances. It wasn't immediately clear to me that the power of the language was bound up with the community and the diverse packages available. Research.stowers-institute.org/mcm/plotlayout.pdf. Statistics books for (free) download. This post will eventually grow to hold a wide list of books on statistics (e-books, pdf books and so on) that are available for free download.
But for now we’ll start off with just one several books: The Elements of Statistical Learning written by Trevor Hastie, Robert Tibshirani and Jerome Friedman. you can legally download a copy of the book in pdf format from the authors website! Direct download (First discovered on the “one R tip a day” blog)Statistics (Probability and Data Analysis) – a wikibook. Download linkIntroduction to Statistical Thought by Michael Lavine.
The book is organized into seven chapters: “Probability,” “Modes of Inference,” “Regression,” “More Probability,” “Special Distributions,” “More Models,” and “Mathematical Statistics.” and makes extensive use of R. Several of these books were discovered through a CrossValidated discussion: Home. Social Network Analysis in R. Home » Lab table of contents To run the following labs install R (Linux, MacOS X or Windows) and execute the following command in R (this will download and install all needed packages and data): source(" Chapters 1. “Introductory Lab.” 2. 3. R news & tutorials from the web. Building a package in RStudio is actually very easy.
So, you’ve written some code and you use it routinely. Now you’ve written some code and you’d like to use version control to ensure that development continues in a robust fashion. You do that and you use Github or something so that not only are changes tracked, but the general public receives the benefit of your knowledge. At the same time, you receive the benefit of their editing and ideas, but in a secure way. Now what? All that useful, well-functioning code needs a home, some documentation and a little dignity. This is actually very easy to do. Start with a Github repository. And that’s it. RStudio has fine- if brief- documentation on their site, with links to more detailed guidance. Of course, that’s only about half the story. Simulation in R. Probability Distributions.
RCC. R. Coding Standards - Bioconductor Wiki. These "standards" are really just Seth Falcon's preferences of how he likes to do things. Many of them are shared by other developers. They are not enforced. However, using similar coding style will help other people in understanding your code. R code style guide « 4D Pie Charts. The igraph library for complex network research. R. An Introduction to R. Table of Contents This is an introduction to R (“GNU S”), a language and environment for statistical computing and graphics. R is similar to the award-winning1 S system, which was developed at Bell Laboratories by John Chambers et al. It provides a wide variety of statistical and graphical techniques (linear and nonlinear modelling, statistical tests, time series analysis, classification, clustering, ...).
This manual provides information on data types, programming elements, statistical modelling and graphics. This manual is for R, version 3.1.0 (2014-04-10). Copyright © 1990 W. Permission is granted to make and distribute verbatim copies of this manual provided the copyright notice and this permission notice are preserved on all copies. Preface.