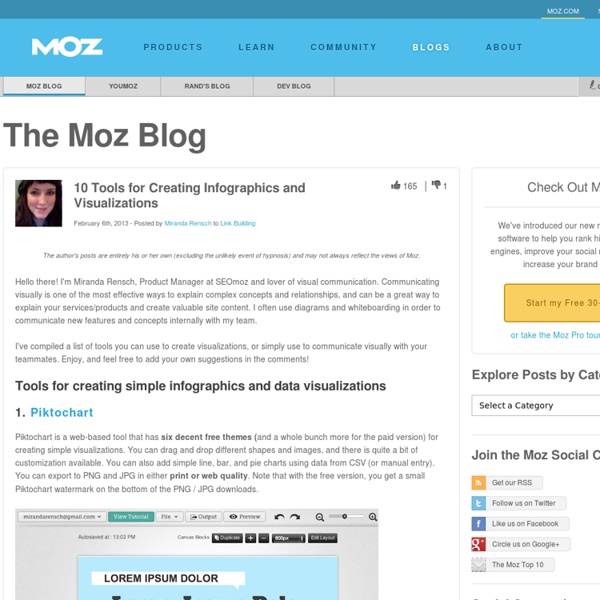
15 Free Infographic Design Kits
Here we are presenting some infographics design kits for you that you can download and use for free. With the help of Infographics, you can easily and effectively represent financial data, workflow and processes. However, designing Infographics from the scratch can be a tedious and time consuming task, and for the graphic designers and web designers, time is a precious commodity that they must utilize in the most appropriate manner. In order to create Infographics, you need to draw charts, graphs and diagrams along with icons and symbols that would certainly consume loads of time.
Great tools for data visualization
Most data is meaningless to most people — unless it is visualized. Stepping beyond familiar visualizations like bar charts and pie charts, there are many approaches to visualizing data, from mapping (e.g., color coding a map to show voting patterns) to visualizing networks (e.g., the links between people). You are not limited to Microsoft Excel, or your own programming abilities. We’re now in an awesome generation for visualization, with dozens of freely available software libraries — which developers have spent months (or years!)
17 Free Awesome Data Visualization Tools: Free Software
1. StatPlanet StatPlanet is an easy-to-use, interactive data visualization and mapping software. StatPlanet can be used to create maps, dashboards, charts, and graphs to bring your data to life.
Download Visio Stencil and Template for UML 2.2
Updated December 27, 2013. Check what's new in the Update Log. The UML stencil for Microsoft Visio supports complete UML 2.5, i.e. UML use case diagram, class diagram, package diagram, object diagram, composite structure diagram, interaction diagram, sequence diagram, communication diagram, interaction overview diagram, activity diagram, state machine diagram, component diagram, deployment diagram, profile diagram, timing diagram, and all symbols of the UML 2.5, specified in OMG Unified Modeling Language (OMG UML), ptc/2013-09-05, as well as all previous UML versions, UML 2.4, UML 2.3, UML 2.2, UML 2.1, UML 2.0, UML 1.5, UML 1.4, UML 1.3 and UML 1.1. The Visio stencils can also be used for SoaML and other UML profiles and dialects. The stencil also contains several non-normative UML symbols, that are not specified in the standard, but used in some UML books and papers.
How Pop Chart Lab Turned Trendy Infographics Into A Serious Business
Halfway into 2014, Pop Chart Lab has released more than a dozen new posters. We’ve covered many of them here on Co.Design: a compendium of sentence diagrams, a guide to the world of whiskey, maps of wineries in Napa, and cocktail bars in New York City, to name a few. The studio's latest project, released yesterday, is a series of city maps available in laser-cut hardboard, oak, walnut, or cherry.
The Data Visualization Beginner’s Toolkit #2: Visualization Tools
(Note: if you are new to this series, the DVBTK doesn’t teach you how to do visualization. Rather it is meant to help people find a less chaotic and more effective path towards the acquisition of the necessary skills to become a data visualization pro. To know more, make sure to read the introduction to the series first.)
Plickers 2.0
An Easy to Use Student Response System Why Should You Use Plickers? Plickers is a FREE app that can be used on any IOS or Android operating system developed by Nolan Amy. Students will receive a card that has a number on it and the answer choices A, B, C, and D. Teachers can print these free at plickers.com as many times as they need. The teacher will use her smart phone or tablet to scan the class cards and begin to immediately see student responses pop up on the screen.
The Back of the Napkin
“Inspiring! It teaches you a new way of thinking in a few hours — what more could you ask from a book?” — Dan Heath,author of Made to Stick “With style and wit, Dan Roam has provided a smart, practical primer on the power of visual thinking. — Daniel H.
How to make an infographic online: five essential free tools
Given the popularity of infographics, you’d be wise to consider using them to help achieve your content marketing goals. They can be great for social sharing, blog fodder and inbound links. The last time I created an infographic I used – wait for it - Microsoft Excel.
The 20 best tools for data visualization
It's often said that data is the new world currency, and the web is the exchange bureau through which it's traded. As consumers, we're positively swimming in data; it's everywhere from labels on food packaging design to World Health Organisation reports. As a result, for the designer it's becoming increasingly difficult to present data in a way that stands out from the mass of competing data streams. Get Adobe Creative Cloud One of the best ways to get your message across is to use a visualization to quickly draw attention to the key messages, and by presenting data visually it's also possible to uncover surprising patterns and observations that wouldn't be apparent from looking at stats alone.