
ProcessWave. Page de démarrage de Mozilla Firefox. Presentations Made Easy. Trends_and_technology_timeline_2010.pdf - Powered by Google Docs. IMPURE. Sign In. Website heat maps, click maps, web analytics. Exalead 0.9. Pikko - Information visualization software. Visualization Options. Hypergraph - Hyperbolic graphs and trees : Home. Hypergraph Winfo. Software > flexplorer. Gallery > graphview demo. Applied Social Network Analysis. Network Workbench. Photo Feed from Instagram. Social Map. Flowchart Software - Online Flow charts software service with Realtime collaboration [2.3.6-r44, updated 2011/03/10 08:14 UTC] WriteMaps Site Map Application: Create, edit, and share your sitemaps online.
Hypergraph - Hyperbolic graphs and trees : Download. Mediaresearch - Network Graph Analysis. You are not a member of this wiki.
Join now Dismiss guest Join | Help | Sign In mediaresearch Home guest| Join | Help | Sign In Home Projects Media Mapping Research Network Graphs >Tools >Navigation >References Semantic Web Network Graph Analysis Edit 0 16 … Table of Contents Languages and Frameworks Plug-and-play Visualization and analysis Gephi Network Workbench Pajek Touchgraph Other Network Visualization Tools Walrus Graph Visualization Other Graph Maintenance/Analysis tools Languages and Frameworks GraphMLTulip Java Universal Network/Graph Framework (JUNG) Plug-and-play Visualization and analysis Gephi Network Workbench Pajek Graphviz (At&T) Prefuse (Berkeley)_gallery.png height="452" caption="Gallery of UC Berkeley Prefuse Projects" NodeXL University Of Maryland Human Computer Interaction Lab NodeXL is an open source Excel add in that allows users with no programming knowledge to generate networks from popular social networks and from custom data sets Touchgraph.
Diagrammr. Visualizing online social networks. Draw Anywhere - easy online diagramming, flow chart. Organizational Chart. Org Chart Software and Organizational Planning. 5 social solutions to boost your website signups. The emergence of the social web has given rise to a number of startups, and provided eco-systems that now support thousands of applications.
With the high quantities of existing users that are active within these networks, and the ongoing technical problem of user management, it’s little surprise that a number of solutions have cropped up to offer an easier way for developers to integrate their users with the social web, and indeed, provide a much quicker, and seamless sign up process. Social sign-on also makes it easier for customers to share information directly to their social network of choice, increasing brand engagement and resulting in an increase in traffic.
I’ve decided to take a closer look at the current range of solutions out there on the web today, for making your application, or its sign-up process integrated more closely with social media. Janrain Pricing: Number of plans (including free option) available Gigya Pricing: Free, although commercial options available on request. RDF-Gravity. Sunil Goyal, Rupert Westenthaler {sgoyal, rwestenthaler}@salzburgresearch.at Salzburg Research, Austria RDF Gravity is a tool for visualising RDF/OWL Graphs/ ontologies.
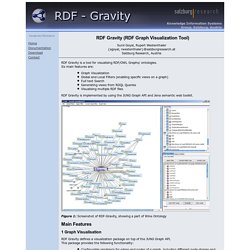
Its main features are: Graph VisualizationGlobal and Local Filters (enabling specific views on a graph) Full text SearchGenerating views from RDQL QueriesVisualising multiple RDF files RDF Gravity is implemented by using the JUNG Graph API and Jena semantic web toolkit. uLearn by Infomapper - online maps for schools. Welcome to the new Sodaplay.
ToonDoo - World's fastest way to create cartoons! Home. Ausstellung von ilh-kunstmanagement. DATA visualisation. Turtle. Tamara Munzner, UBC Home Page. Tamara Munzner InfoVis Group Professor Department of Computer Science, University of British ColumbiaImager Graphics, Visualization and HCI Lab Email: tmm (at) cs.ubc.ca, Phone: 604-827-5200, Fax: 604-822-5485, Twitter: @tamaramunzner Snailmail: 201-2366 Main Mall, Vancouver, BC, V6T 1Z4, Canada Office: X661, in X-Wing extension behind ICICS/CS buildingOffice Hours: by appointment (email me) Calendar: My free/busy calendar.
TimeSpiderTrees. Fabian Beck, Martin Puppe, Patrick Braun, Michael Burch, Stephan Diehl.
Edge Bundling without Reducing the Source to Target Traceability. Mkweb // Martin Krzywinski / Genome Sciences Center. Schemaball is a flexible schema visualizer for SQL databases.
The purpose of Schemaball is to help visualize the relationships between tables. Tables are related by foreign keys, which are fields which store the value of a record field from another table. Foreign keys create a lookup relationship between two tables. Large schemas can have hundreds of tables and table relationships. Keeping track of them call can be tedious, error-prone and slow down the schema development process. Figure | A MySQL schema of our sequencing LIMS database. Schemaball produces images called schema balls.
Schemaball is free software, licensed under GPL. I am not longer actively working on Schemaball. Schemaball was published in SysAdmin Magazine (Krzywinski, M. Enterprise Software Doesn't Have to Suck: Social Network Analysis using R and Gephis. After learning the basics of R, I decided to learn something harder last week.
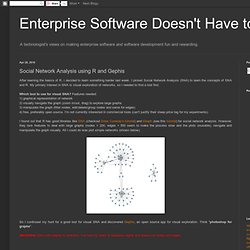
I picked Social Network Analysis (SNA) to learn the concepts of SNA and R. My primary interest in SNA is visual exploration of networks, so I needed to find a tool first. Which tool to use for visual SNA? Gephi, an open source graph visualization and manipulation software.