
LinkedIn Swarm.
SocialWeb. Environment. LinkedIn Swarm. Infographics - Marketing. MOST POPULAR INFOGRAPHICS. Canvas - geometry hierarchy 2. Geometric Constructions. This is a web version of a teacher's workshop presented at Bridges 2004Appeared in: Bridges for Teachers, Teachers for Bridges, 2004 Workshop Book, Mara Alagic and Reza Sarhangi eds., pp. 31-42.
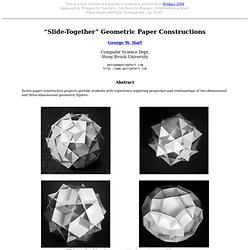
“Slide-Together” Geometric Paper Constructions George W. Hart Computer Science Dept. Stony Brook University george@georgehart.com Abstract Seven paper construction projects provide students with experience exploring properties and relationships of two-dimensional and three-dimensional geometric figures. “Slide-togethers” based on squares, triangles, pentagons, and decagons Introduction This activity consists of seven attractive constructions which are fun and relatively easy to make because one simply cuts out paper pieces and slides them together. Each “slide-together” is made from identical copies of a single type of regular polygon (e.g., just squares or just triangles) with slits cut at the proper locations. “Slide-togethers” based on hexagons, decagrams, and pentagrams. The KnotPlot Site. Gnofract 4D: Superior Fractal Software : Home. Mathematica Visualization and Graphics Gallery of Jeff Bryant.
Polymaps. AmMap: Interactive flash maps. Dzinpress. Protovis Examples + upgrade link. Enjoy these sample visualizations built with Protovis.
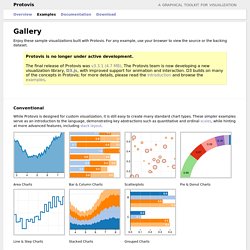
For any example, use your browser to view the source or the backing dataset. Protovis is no longer under active development.The final release of Protovis was v3.3.1 (4.7 MB). The Protovis team is now developing a new visualization library, D3.js, with improved support for animation and interaction. D3 builds on many of the concepts in Protovis; for more details, please read the introduction and browse the examples. Conventional While Protovis is designed for custom visualization, it is still easy to create many standard chart types. Area Charts Bar & Column Charts Scatterplots Pie & Donut Charts Line & Step Charts Stacked Charts Grouped Charts Custom Many charting libraries provide stock chart designs, but offer only limited customization; Protovis excels at custom visualization design through a concise representation and precise control over graphical marks. Anderson’s Flowers Becker’s Barley Bertin’s Hotel Streamgraphs Sparklines Bullet Charts.
Infographic. Infographics - brands. Infographics - Social Networks. Animating Water Using Flow Maps. Last week I attended SIGGRAPH 2010, and among the many good presentations, Valve game a talk on the simple water shader they implemented for Left For Dead 2 and Portal 2.
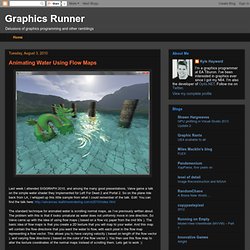
So on the plane ride back from LA, I whipped up this little sample from what I could remember of the talk. Edit: You can find the talk here: The standard technique for animated water is scrolling normal maps, as I’ve previously written about. The problem with this is that it looks unnatural as water does not uniformly move in one direction. So Valve came up with the idea of using flow maps ( based on a flow viz paper from the mid 90s ). The Flow Map First we need to create a flow map. Using The Flow Map Now we need to use the flow map to alter the water normal maps. The graph illustrates that during a cycle time from 0 to 1, we want the layer to be fully interpolated at the mid-point in the cycle, and fully un-interpolated at 0 and 1. In the code above, HalfCycle would be .5 if our cycle was from 0 to 1.
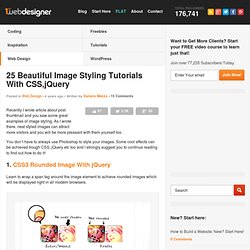
25 Beautiful Image Styling Tutorials With CSS,jQuery. Recently I wrote article about post thumbnail and you saw some great examples of image styling.
As I wrote there, neat styled images can attract more visitors and you will be more pleasant with them yourself too. You don’t have to always use Photoshop to style your images. Some cool effects can be achieved trough CSS, jQuery etc too and I strongly suggest you to continue reading to find out how to do it!
1. CSS3 Rounded Image With jQuery Learn to wrap a span tag around the image element to achieve rounded images which will be displayed right in all modern browsers. 2.Multiple Backgrounds and Borders with CSS 2.1 Learn how to use CSS 2.1 pseudo-elements to provide up to 3 background canvases, 2 fixed-size presentational images, and multiple complex borders for a single HTML element. 3. Quick screencast showing you how to achieve multiple borders with simple CSS that way adding more depth to your designs.