
Infographics - Shelly Sanchez Terrell. 23 Great Tools and Resources for Creating and Learning with Infographics – American TESOL Institute. Data visualization can help language learners process difficult concepts, visualize research, or understand a process.
What Is An Infographic? Using Infographics in the ELT classroom. Photo by Victoria Boobyer provided courtesy of ELTPics Infographic.
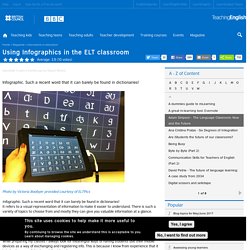
Such a recent word that it can barely be found in dictionaries! It refers to a visual representation of information to make it easier to understand. There is such a variety of topics to choose from and mostly they can give you valuable information at a glance. The idea Once when I was preparing my classes, it occurred to me that an infographic could somehow add up to it.While preparing my classes I always look for meaningful ways of having students use their mobile devices as a way of exchanging and registering info. Then there was the topic of friendship for that specific class and, while trying to find other resources to collaborate with the lesson delivery, making use of an infographic came to mind.
Class design. How to Create Amazing Infographics. Creating infographics. How To Design Your Own Infographics. Infographics. Why Infographics? Embed Code Embeded for hosted site: Click the code to copy <div class='visually_embed'><img class='visually_embed_infographic' src=' alt='Why Infographics?
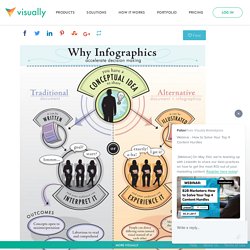
' /><div class='visually_embed_cycle'></div><script type='text/javascript' src=' class='visually_embed_script' id='visually_embed_script_903'></script><p> From <a href=' How to Make an Infographic: Free Visual E-Book for Beginners. On average, Americans consume 63 gigabytes of information per person per day.
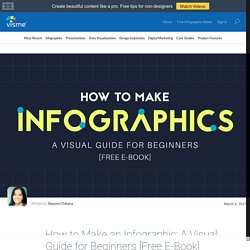
That’s roughly half of all the storage space in a new MacBook Air laptop. With so much information bombarding us on a daily basis, it’s no wonder we’ve become desensitized to even the most shocking statistics. For example, what if I told you that the 74 million richest people in the world possess 50% of its wealth? The real meaning of this statement would probably be lost on most of us. The moment you translate it into a visual format, however, it suddenly becomes a much more palpable — and shocking — reality: That’s the power of infographics. Infographic Lesson Plan. Students will create an infographic to share knowledge and data about an issue or science topic they are studying.
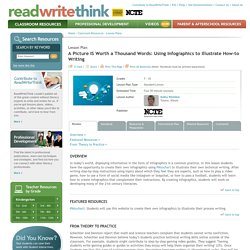
App: Share™ Task Infographics are an increasingly popular way of sharing information in newspapers, magazines, and online news sites. Infographics / Lesson Plan Resources. Pre-Instruction Activity Think-Pair-Share: Which do you prefer, reading or infographic?
Why? What are similarities and differences? Instruction Teacher led presentation on creating an infographic. Student Directions: Look for an infographic that you find "appealing" using the links below. A Picture IS Worth a Thousand Words: Using Infographics to Illustrate How-to Writing. Overview Featured Resources From Theory to Practice In today’s world, displaying information in the form of infographics is a common practice.
Design School — Teaching Materials. Infographic Creation Tools. Infographics, Rubrics, and a Seated Poster Session – Agile Learning. A few weeks ago here, I wrote about a rubric for evaluating infographics that my students helped design.
That rubric was created in service to the final application project in my spring stats course. Students used the statistical techniques they learned this semester to answer questions about “real world” data sets, then communicated their results via infographics. The infographics are complete now and are available over on my course website. I thought I would follow up on my earlier post about the rubric and describe the rest of my process for this assignment, including the “seated poster session” that wrapped it up. First, a recap of that earlier post: I asked students to find and share examples of good infographics. What’s happened since then? A Crowdsourced Rubric for Evaluating Infographics – Agile Learning. I’m teaching a statistics course this spring.
It’s the fourth time I’ve taught this course, and, in an effort to make it more interesting to me and more useful for my students, I added a module on data visualization to the course this time around. I find that the data visualization chapters in most statistics textbooks look like they could have been written in the 1950s, featuring stem-and-leaf plots, box-and-whisker plots, and other very analog visualization tools.
Modern data visualization tools are much more sophisticated than these, and, more importantly, these modern tools are needed to handle the multi-dimensional data sets that digital tools now make available. Check out, for instance, this bubble chart displaying executive salaries or this live heatmap of tweets made around the world or this interactive treemap of earthquakes since 1900. Infographics / Lesson Plan Resources. A Picture IS Worth a Thousand Words: Using Infographics to Illustrate How-to Writing. Infographic Lesson Plan Page for Teachers (boring stuff my students won't want to read!) - Infographics.
(Although these lessons may be adapted to fit most grade levels from 6-12) Writing Production and Distribution of Writing 4.
Produce clear and coherent writing in which the development, organization, and style are. Glogin?URI= A BBC documentary featured Dr. Hans Rosling, a founder of Gapminder, which uses data animation to educate the public about gaps in health and wealth. Go to related article » “In an uncharted world of boundless data, information designers are our new navigators,” begins a recent Times article, “When the Data Struts Its Stuff.” Last summer we did a popular series of posts on classroom uses for data visualization — the graphs, charts, timelines, diagrams, flowcharts, interactive slide shows and maps also called “infographics.” You can find all five posts linked from the first one, “Teaching With Infographics | Places to Start.” Today we add to our collection with some new resources inspired by this latest Times article. Key Questions. The Educators’ Guide to Infographics. Sometimes when you’re compiling your content for your next blog post you find that, to get your point across, you have to cover a lot of facts and figures, statistics, or tabular information, and it’s really tricky to put into words.
Wouldn’t it be great if you could easily compile it all into a vibrant and easy to read chart, or even a collection of charts that are all related? Then, wouldn’t it be great if it was all in one image that you could share to other people, or even print to stick on the wall of your classroom? Search no more, for we have your solution. Diagram Examples Drawn Using Creately. Infographics Templates. How to Create Amazing Infographics. Infographics make complex information eye catching, shareable and easily digestible.
Most importantly, they play a crucial role in the increasingly visual world of marketing. Did you know that adding images to your Facebook posts can generate up to 65% more interaction from your fans? Boost your social media engagement by creating amazing infographics in Canva. To put these skills into practice, leap into the interactive design tutorial at the end of this article. Shapes help contain your content and create visual focus. You can search ‘Shapes’ or ‘Infographics’ in the Canva search bar to navigate hundreds of different options. Pin by Piktochart on Education. Infographics, Concept & Visual Storytelling. Storytelling With Infographics. The process of designing an infographic.
How to Create Infographic Elements in PowerPoint. Infographics - HOME. Social Analytics Reports and Infographics. Infographic design. Infographics for iPhone. 13 Reasons Why Your Brain Craves Infographics [HTML 5] 10 Free Web Tools To Make Your Own Infographics. Making images interactive. Thinglink is definitely one of my favourite tools at the moment. I've already used it in my classes and in teacher training courses and here are some of the reasons why I'm so excited about it: - it's a neat tool for creating interactive and collaborative images in our classroom or as a homework task; - we / collaborators can tag images with any content (including videos, sounds and music from differnt sources) and then we can also share it (by email, in Facebook, Twitter, blog...); - the chosen images come alive not only with what you can tag but also by adding colourful pins.
This school year I'm teaching a Tourism and Hospitality class and as far as possible I've been trying to develop materials that can somehow be useful to them or even to the community. I took pics in Soure and produced this video and, in class, I shared this Thinglink (below) - a map of Soure and its twelve civil parishes - so that learners could tag with relevant content. Now, how is it done? Again, simple! An Infographic Guideline For Making Good Infographics.
46 Tools To Make Infographics In The Classroom. Infographics are interesting–a mash of (hopefully) easily-consumed visuals (so, symbols, shapes, and images) and added relevant character-based data (so, numbers, words, and brief sentences). The learning application for them is clear, with many academic standards–including the Common Core standards–requiring teachers to use a variety of media forms, charts, and other data for both information reading as well as general fluency.
It’s curious they haven’t really “caught on” in schools considering how well they bridge both the old-form textbook habit of cramming tons of information into a small space, while also neatly overlapping with the dynamic and digital world. The Best Infographics. -----------------------------------------★ 네트웍이 연결되지 않은 상태에서는 '내 서재'만 표시됩니다. Static.squarespace.com/static/50eca855e4b0939ae8bb12d9/t/51100144e4b0837c15801345/1360003396863/Show What You Know Infographic by Tony Vincent.pdf. iTunes App Store'da iPhone, iPod touch ve iPad için Grafio Lite - Diagrams & Ideas. The Proof That We Are Soulmates. Many Eyes.
Use-Infographics.jpg (800×1049) Infographics, Explained by LEGOs. LEGO bricks illustrate the simple idea behind infographics. Data: sorted, arranged, presented visually. Got it? Good. 10 Fun Tools To Easily Make Your Own Infographics. People love to learn by examining visual representations of data. Infographic. Infographics Lesson Plans. David McCandless: The beauty of data visualization.
Venngage - Think with your eyes. Journalism in the Age of Data: A Video Report on Data Visualization by Geoff McGhee. Public Data Explorer. InfoGraphic Designs: Overview, Examples and Best Practices. Information graphics or infographics are visual representations of information, data or knowledge. These graphics are used where complex information needs to be explained quickly and clearly, such as in signs, maps, journalism, technical writing, and education. They are also used extensively as tools by computer scientists, mathematicians, and statisticians to ease the process of developing and communicating conceptual information. They can present a rich amount of information without intimidating you. Or sometimes they intimidate you, but make the digesting of the information much more bearable.
Here in this article below, we are going to discuss best practices for designing infographics followed by some examples which might help you learn a thing or two. You may be interested in the following related articles as well. Infographics. Hyperakt » Meaningful Design for the Common Good. Information Is Beautiful. July 2011. About us Courses & workshops Consultancy services Clients & publications. Infographics / Lesson Plan Resources. What Is An Infographic?