
General Digital Collections. 1746 map of London now available as an incredibly detailed Google map. The Centre for Metropolitan History and Museum of London Archaeology wanted a map that could help them visualise data from the 18th and 19th centuries.
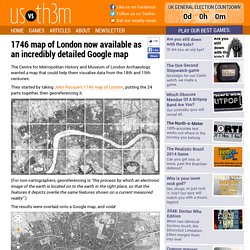
They started by taking John Rocque’s 1746 map of London, putting the 24 parts together, then georeferencing it. (For non-cartographers, georeferencing is “the process by which an electronic image of the earth is located on to the earth in the right place, so that the features it depicts overlie the same features shown on a current measured reality”.) The results were overlaid onto a Google map, and voila! You can travel through London as it was in 1746, and, as a added bonus, see the differences between then and now by moving the StreetView icon around. Example: in 1746, Southwark was mainly a giant field, but look at all the blue lines on top of it! Search results - NYPL Digital Collections. Map Warper: Home. Medieval Maps. Map Projections: From Spherical Earth to Flat Map. Cartographies of Time: A Visual History of the Timeline. By Maria Popova A chronology of one of our most inescapable metaphors, or what Macbeth has to do with Galileo.
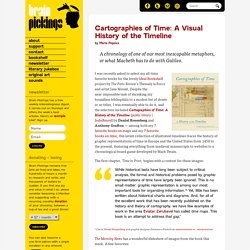
I was recently asked to select my all-time favorite books for the lovely Ideal Bookshelf project by The Paris Review’s Thessaly la Force and artist Jane Mount. Despite the near-impossible task of shrinking my boundless bibliophilia to a modest list of dozen or so titles, I was eventually able to do it, and the selection included Cartographies of Time: A History of the Timeline (public library | IndieBound) by Daniel Rosenberg and Anthony Grafton — among both my 7 favorite books on maps and my 7 favorite books on time, this lavish collection of illustrated timelines traces the history of graphic representations of time in Europe and the United States from 1450 to the present, featuring everything from medieval manuscripts to websites to a chronological board game developed by Mark Twain. The first chapter, Time in Print, begins with a context for these images: Donating = Loving. Legendary Lands: Umberto Eco on the Greatest Maps of Imaginary Places and Why They Appeal to Us.
By Maria Popova “Often the object of a desire, when desire is transformed into hope, becomes more real than reality itself.”
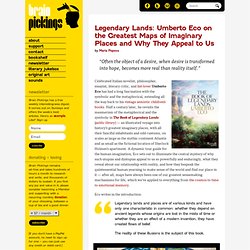
Celebrated Italian novelist, philosopher, essayist, literary critic, and list-lover Umberto Eco has had a long fascination with the symbolic and the metaphorical, extending all the way back to his vintage semiotic children’s books. Half a century later, he revisits the mesmerism of the metaphorical and the symbolic in The Book of Legendary Lands (public library) — an illustrated voyage into history’s greatest imaginary places, with all their fanciful inhabitants and odd customs, on scales as large as the mythic continent Atlantis and as small as the fictional location of Sherlock Holmes’s apartment.
Eco writes in the introduction: Saint-Sever World Map, from the 'Saint-Sever Beatus' (1086), Paris, Bibliothèque nationale de France T and O map, Bartholomaeus Angelicus, 'Le livre des propriétés des choses' (1392) Section of the 'Tabula Peutingeriana' (12th-century copy) GmapGIS - A web based GIS application to draw on Google maps: polygons, lines, markers and labels.
Editor for Google Maps [MapFab.com] GeoCommons. Scribble Maps - Draw on google maps with scribblings and more! Digital Geography. Mapping Tools. Scribble Maps - Draw on google maps with scribblings and more! Map Icons - Download 126 Free Map Icon (Page 2) UMapper / Home. Create and design your own charts and diagrams online. About ChartsBin.com. Atelier Campus Rennes 2. Google I/O 2011: Managing and visualizing your geospatial data with Fusion Tables. Working with Google Fusion. How to make a map in Google Fusion Tables. Subscribe to slideshows: RSS IT Certification Study Tips Register for this Computerworld Insider Study Tip guide and gain access to hundreds of premium content articles, cheat sheets, product reviews and more.
Register for FREE now! » How Four Citrix Customers Solved the Enterprise Mobility Challenge Managing mobile devices, data and all types of apps-Windows, datacenter, web and native mobile- through a single solution. 8 Steps to Fill the Mobile Enterprise Application Gap Traveling executives and Millennials alike expect to communicate, collaborate and access their important work applications and data from anywhere on whatever device they... Seattle Children's Accelerates Citrix Login Times by 500% with Cross-Tier Insight Seattle Children's is a leading research hospital with a large and growing Citrix XenDesktop deployment. McKesson Makes Application Hosting for Hospitals Faster, More Efficient The Shortfall of Network Load Balancing. Google Maps. Carte chloropethe communes belges - Google Fusion Tables. Kartograph.org.
Freehand Drawing Utility: Draw on a map and save GPX data. Scribble Maps : Draw On Maps and Make Them Easily. GmapGIS - A web based GIS application to draw on Google maps: polygons, lines, markers and labels. Unfolding Maps: Unfolding is a library to create interactive maps and geovisualizations in Processing and Java. Editor for Google Maps [MapFab.com] Make Maps Online with Click2Map. History of Geography as a Timeline - Geolounge. Listed here are significant events that happened in the field of Geography.
Covered are events and advances in world geography, human geography, physical geography, and cartography/GIS. Some notes about this timeline page: This timeline on the history of geography is still very much a work in progress. You can help contribute to its development by submitting significant events in the field of geography here. Map of Pangea With Current International Borders. 56.1K 2935Share51 View larger The good people at Open Culture recently shared this map of Pangea with the present day country names.
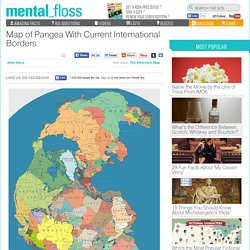
If the band ever gets back together, here's who your nation's neighbors would be. Cartographer.js – thematic mapping for Google Maps. Listing. Cities: an interactive data visual. This is an updated and expanded version of the data visual first posted in June 2014.
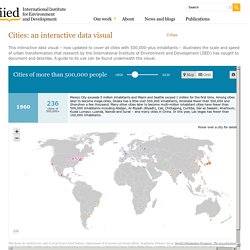
It draws on a new dataset from the United Nations Population Division. It also covers all cities with 500,000-plus inhabitants, compared to the earlier version that covered cities with 750,000-plus inhabitants. Guide to use. GIS MOOC Roundup. John Wesley Powell 19th Century Maps of the American West. In the decades after the Civil War, Americans rushed headlong into the west.
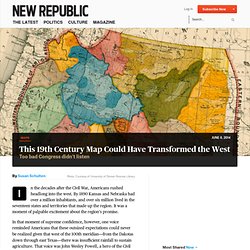
By 1890 Kansas and Nebraska had over a million inhabitants, and over six million lived in the seventeen states and territories that made up the region. It was a moment of palpable excitement about the region’s promise. In that moment of supreme confidence, however, one voice reminded Americans that these outsized expectations could never be realized given that west of the 100th meridian—from the Dakotas down through east Texas—there was insufficient rainfall to sustain agriculture. Richard Edes Harrison Reinvented Mapmaking for World War 2 Americans. More Americans came into contact with maps during World War II than in any previous moment in American history.
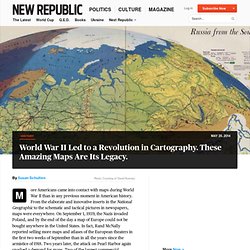
From the elaborate and innovative inserts in the National Geographic to the schematic and tactical pictures in newspapers, maps were everywhere. On September 1, 1939, the Nazis invaded Poland, and by the end of the day a map of Europe could not be bought anywhere in the United States. OpenCage Geocoder. Examples: Google Maps Heatmap Layer. Examples: Leaflet Heatmap Layer. Maps Engine. GmapGIS - A web based GIS application to draw on Google maps: polygons, lines, markers and labels. QGIS: Introducing the Quantum GIS Ecosystem. Anita Graser provides an introduction to the desktop, web, and mobile capabilities of the open source GIS software, QGIS in this guest article.
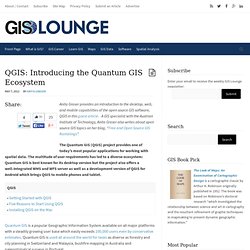
A GIS specialist with the Austrian Institute of Technology, Anita Graser also writes about open source GIS topics on her blog, “Free and Open Source GIS Ramblings”. The Quantum GIS (QGIS) project provides one of today’s most popular applications for working with spatial data. The multitude of user requirements has led to a diverse ecosystem: Quantum GIS is best known for its desktop version but the project also offers a well-integrated WMS and WFS server as well as a development version of QGIS for Android which brings QGIS to mobile phones and tablet.
Quantum GIS is a popular Geographic Information System available on all major platforms with a steadily growing user base which easily exceeds 100,000 users even by conservative estimates. QGIS on the Desktop. CartoDB. The Language of Maps Kids Should Know. Though in the age of iPhones and GPSs we seem to be losing paper maps, I still love exploring maps, and believe kids need to learn map skills, and develop their geography awareness. Because of this I have many activities on Kid World Citizen to help parents and teachers teach children about maps. Kids not only can learn to read them, but to recognize their components and build their own maps. GeoCommons. Knowledge Cartography. Learn What Spatial Analysis Can Do for You.