
Mike’s Baseline Trick? Don’t panic – a new baseline for global temperature may cool future debate – Watts Up With That? Statistical politics – Prof.
Mike Hulme on ‘politically charged’ climate baseline changes from 1961-1990 to 1991-2020: ‘In an instant; today, the world’s climate has ‘suddenly’ become nearly 0.5°C warmer’ From Climate Depot Hulme: “January 12021, a new World Meteorological Organisation (WMO) climatological standard normal came into effect. The ‘present-day’ climate will now formally be represented by the meteorological statistics of the period 1991-2020, replacing those from 1961-1990. “So, what is the significance of the move to a new 1991-2020 WMO normal in January 2021? “Combining a climatic tolerance of 2°C—or indeed 1.5°C—with a pre-industrial baseline yields a very different climate target than, say, using a 1986-2005 baseline, the period widely adopted by IPCC AR5 Working Group I as their analytical baseline. How To Use CLIMOD 2. By Paul Homewood As you know, I have been using CLIMOD 2 a lot lately.

It is a very powerful analytical tool for working with official NOAA temperature and rainfall data. It takes a bit of getting used to, but is easy once you get the hang. Comparing USCRN and nClimDiv to USCHN. By Andy May Steven Mosher complained about my previous post on the difference between the final and raw temperatures in the conterminous 48 states (CONUS) as measured by NOAA’s USCHN.
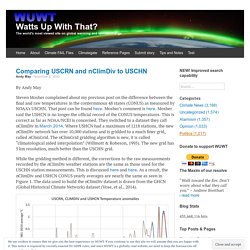
That post can be found here. Study: Global Warming Heating Nights Faster than Days. Guest essay by Eric Worrall And both increased and decreased cloud cover is bad.

Global heating warming up ‘nights faster than days’Effect seen across much of world will have profound consequences, warn scientistsDamian CarringtonEnvironment editorThe climate crisis is heating up nights faster than days in many parts of the world, according to the first worldwide assessment of how global heating is differently affecting days and nights.The findings have “profound consequences” for wildlife and their ability to adapt to the climate emergency, the researchers said, and for the ability of people to cool off at night during dangerous heatwaves.The scientists compared the rises in daytime and night-time temperatures over the 35 years up to 2017.
Global heating is increasing both, but they found that over more than half of the world’s land there was a difference of at least 0.25C between the day and night rises.
Concerns about the Temperature Data. Tree Rings: Data Concerns. Temperature Data as Anomolies. Ocean Temperature Data. Mechanics of Temperature Reconstructions. A Surfeit Of Temperatures. Guest Post by Willis Eschenbach My last two posts, one on Gavin’s claims and the other on the Urban Heat Island (UHI) effect, have gotten me to thinking about the various groups producing historical global surface temperature estimates.
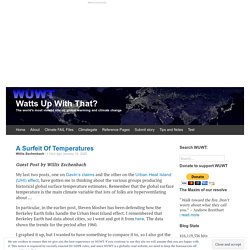
Remember that the global surface temperature is the main climate variable that lots of folks are hyperventilating about … In particular, in the earlier post, Steven Mosher has been defending how the Berkeley Earth folks handle the Urban Heat Island effect. I remembered that Berkeley Earth had data about cities, so I went and got it from here. GMSL Data Correction. Brief Note by Kip Hansen — 10 January 2020 Those who follow the GMSL data from NOAA may have noticed an oddity in the data from December 2019.
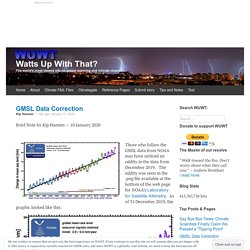
The oddity was seen in the .png file available at the bottom of the web page for NOAA’s Laboratory for Satellite Altimetry. As of 31 December 2019, the graphic looked like this: Historical Climate Data - Climate - Environment and Climate Change Canada. Ocean Temperature Changes Are Uneven And Uncertain. A new paper from the Global Warming Policy Foundation looks at how scientists monitor changes in ocean temperature and finds a story of huge uncertainties and surprising findings.
For example, while warming might be expected to be fairly uniform, measurements suggest that it is regionalised, with parts of the South Pacific, in particular, warming more than elsewhere. As the report’s author, Dr David Whitehouse, says, it is hard to draw firm conclusions about what is happening in the seas: “The oceans can absorb far more heat than the atmosphere, so temperatures changes are extremely small and therefore hard to measure reliably.” The Gestalt of Heat Waves. Guest post by Clyde Spencer Abstract Tmax and Tmin time-series are examined to look for historical, empirical evidence to support the claim that heat waves will become more frequent, of longer duration, and with higher temperatures than in the past.
The two primary parameters examined are the coefficient of variation and the difference between Tmax and Tmin. Want to know what climate change will do in your back yard? There’s a dataset for that. The 7-terabyte dataset, the largest of its kind, helps envision climate-change scenarios at scales as small as 1 kilometer; a new review validates and describes the dataset International Center for Tropical Agriculture (CIAT) A small bean farm in Colombia’s Darién region.

Future climate scenarios can be modeled at the community scale thanks to a dataset created by the CGIAR research program on Climate Change, Agriculture and Food Security (CCAFS) and the International Center for Tropical Agriculture (CIAT). Credit Neil Palmer / International Center for Tropical Agriculture. Alarmism Exposed: The entire world is warming faster than the entire planet. Back in 2010, WUWT published a story called “Faster than everyplace else…” It illustrated how the media has portrayed warming as being “doubly bad” where you live.
Only one problem – we compared stories, and what we found is pretty ridiculous. Here’s a video update: Like this: Like Loading... Related. Delingpole: Environment Canada Airbrushes 100 Years of Inconvenient Climate Data out of History. By Paul Homewood h/t Athelstan If you thought it was only NOAA, NASA, UK Met Office, Australian BOM and Uncle Tom Cobley who have been cheating, think again. Unlocking pre-1850 instrumental meteorological records: A global inventory. From the Bulletin of the American Meteorological Society Stefan Brönnimann Affiliations Institute of Geography and Oeschger Centre, University of Bern, Switzerland Published Online: 10 September 2019 Abstract.
Climate4you. Wood for Trees: Interactive Graphs. Rare Weather Station: Unchanged Over 138 Years, Data Show No CO2 Impact On Temperature! In Germany there is one weather station that has be intact and unchanged for some 138 years. It has never been moved and never been corrupted by the urban heat island (UHI) effect. Moreover it has consistently used the same instrumentation and computation method over the entire period, thus making it rare indeed. A sceptic’s guide to global temperatures.
Climate change may well turn out to be a benign problem rather than the severe problem or “emergency” it is claimed to be. This will eventually depend on just how much the earth’s climate is warming due to our transient but relatively large increase in atmospheric CO2 levels. This is why it is so important to accurately and impartially measure the earth’s average temperature rise since 1850. Earth Surface Temperature Data Too Scant, No Certainty. Southern Hemisphere Stations Show Cooling Since 1880!
By Kirye and Pierre Gosselin It is a fact that land surface temperature records going back before 1900 globally are very few and sparse. Worldwide there are only 116 stations Version 3, unadjusted datasets that go all the way back to January 1880 – most of them are located in USA and Europe (northern hemisphere). State of The Climate Report Reveals 23-Year Temperature Pause in the Stratosphere. What is Global Temperature? Is it warming or cooling? H/T graeme for asking a good question. This blog features a monthly update on ocean SST averages from HadSST3 (latest is Oceans Cool Off Previous 3 Years).
Graeme added this comment:I came across this today. Can you comment as your studies seem to show the reverse! Regards, Graeme While thinking about a concise, yet complete response, I put together this post. How The US Temperature Record Has Changed. How to make use of the world’s most accurate surface temperature data. Steve, in Seattle writes: I began this project out of both frustration and a specific curiosity. I have, over the years, studied many excellent articles at WUWT. The Climate Scales In Our Eyes - The Global Warming Policy Forum (GWPF) Analysis says NOAA global temperature data ‘doesn’t constitute a “smoking gun” for global warming’ Mikhail Voloshin writes this detailed analysis of NOAA and GISTEMP climate data processing on his Facebook page:
Global Temperature Trends Based On Non-Existent Data. Do Doomsters Know How Much Global Surface Temperatures Cycle Annually. What We Know About CO2, Global Atmospheric Temperatures. Despite large uncertainties and many unknowns in Earth Science, scientists have a reasonable understanding of the answers to these questions. The Limits Of Uncertainty. Climatism and the Reification of Global Temperature – Mike Hulme. Radiosondes Show That After Decades of Cooling, the Lower Stratosphere Is Now Warming - Philipona - 2018 - Journal of Geophysical Research: Atmospheres.
Since the mid‐twentieth century, radiosonde and satellite measurements show that the troposphere has warmed and the stratosphere has cooled. Remote Sensing Systems. While much of the world shows moistening to various degrees, there are regions of very substantial drying in the central tropical Pacific Ocean on either side of the equator. Nyquist, sampling, anomalies and all that.
Guest post by Nick Stokes, Every now and then, in climate blogging, one hears a refrain that the traditional min/max daily temperature can’t be used because it “violates Nyquist”. In particular, an engineer, William Ward, writes occasionally of this at WUWT; the latest is here, with an earlier version here. But there is more to it. Analysis Of 7 California Stations Shows No Precipitation Trend Change. Part 2: “…it is the change in temperature compared to what we’ve been used to that matters.” Part 3: “…it is the change in temperature compared to what we’ve been used to that matters.” WMO Reasoning behind Two Sets of “Normals” a.k.a. Two Periods of Base Years for Anomalies. GISS Makes a Useful Reference Disappear from their Land-Ocean Temperature Index Data Page. What Was Earth’s Preindustrial Global Mean Surface Temperature, In Absolute Terms Not Anomalies, Supposed to Be? Global Temperature Datasets “are not a valid representation of reality”. SIGNAL CONVOLUTION, MIDPOINT OF RANGE, AND ALL THAT.
Are land + sea temperature averages meaningful? Durable Original Measurement Uncertainty. Daily Averages? Not So Fast… Climate Research in the IPCC Wonderland: What Are We Really Measuring and Why Are We Wasting All That Money? Does NASA’s Latest Study Confirm Global Warming? Comparing the Four Global Temperature Data Sets. GISS Global Land-Ocean Temperature Index Vs GHCN. The Reference Frame: GISS: 1998-2016 comparison suggests a trend of 2 °C per century.
CERES Compared with BEST, HadCRUT and UAH. Uncertainty Mounts…Global Temperature Data Presentation “Flat Wrong”, New Danish Findings Show. On Cowtan and Way (2013) “Coverage bias in the HadCRUT4 temperature series and its impact on recent temperature trends”