
HadCRUT, Numbers 4 And 5 – Watts Up With That? Guest Post by Willis Eschenbach The HadCRUT record is one of several main estimates of the historical variation in global average surface temperature.

It’s kept by the good folks at the University of East Anglia, home of the Climategate scandal. Periodically, they update the HadCRUT data. They’ve just done so again, going from HadCRUT4 to HadCRUT5. Best Climate Change Temperatures – Watts Up With That? By Andy May I just gave an informal Zoom talk to a small group on measuring climate change through temperatures.
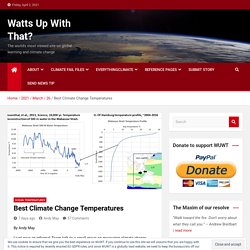
The host, Dave Siegel, recorded it and has posted the presentation here, if you want to view it. It is about 15 minutes, plus some discussion afterword. Recent USHCN Final v Raw Temperature differences. By Andy May While studying the NOAA USHCN (United States Historical Climate Network) data I noticed the recent differences between the raw and final average annual temperatures were anomalous.
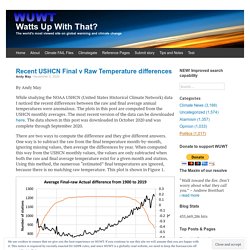
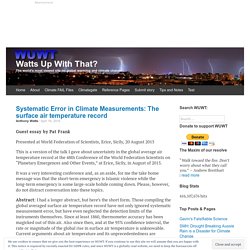
The plots in this post are computed from the USHCN monthly averages. The most recent version of the data can be downloaded here. The data shown in this post was downloaded in October 2020 and was complete through September 2020. There are two ways to compute the difference and they give different answers. Figure 1. In Figure 1 we can see two things. Figure 2. Systematic Error in Climate Measurements: The surface air temperature record.
Guest essay by Pat Frank Presented at World Federation of Scientists, Erice, Sicily, 20 August 2015 This is a version of the talk I gave about uncertainty in the global average air temperature record at the 48th Conference of the World Federation Scientists on “Planetary Emergences and Other Events,” at Erice, Sicily, in August of 2015.
It was a very interesting conference and, as an aside, for me the take home message was that the short-term emergency is Islamic violence while the long-term emergency is some large-scale bolide coming down. Please, however, do not distract conversation into these topics. Abstract: I had a longer abstract, but here’s the short form. On the 1998 Apparent Step-Up in UAH Land-minus-Ocean Lower Tropospheric Temperatures. Reposted from Dr Roy Spencer’s Blog November 7th, 2019 by Roy W.

Spencer, Ph. D.
Satellite Data. How Not To Measure Temperature. UAHv6.0 tlt corroborated « Okulær. Tamino’s radiosonde problem, Part 1 « Okulær. Government Climate Math. As Hurricane Michael came on shore, NOAA reported peak gusts of 119 MPH, with maximum sustained winds of 150 MPH.
This makes no sense mathematically or scientifically, but makes perfect sense from the point of view of global warming propagandists. Hurricane MICHAEL Then the fraudsters at Weather Channel upped the ante, and added an extra 10 MPH to the peak gust. Michael Now Accelerating Through Central Georgia; Deadly Storm Surge, Damaging Winds Continue Following Florida Panhandle Landfall | The Weather Channel After all of this junk science and garbage mathematics, Hurricane Michael officially became the third most intense hurricane on record. This is all because … science. Almost Earth-like, We’re Certain. Guest Essay by Kip Hansen There has been a lot of news recently about exoplanets.

An extrasolar planet is a planet outside our solar system. The Wiki article has a list of exoplanets. I only mention exoplanets because there is a set of criteria for specifications of what could turn out to be an “Earth-like planet”, of interest to space scientists, I suppose, as they might harbor “life-as-we-know-it” and/or be a potential colonization target.
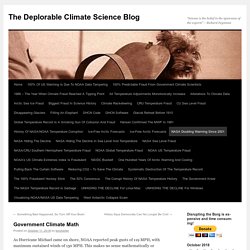
One of those specifications for an Earth-like planet is an appropriate average surface temperature, usually said to be 15 °C. This chart from the Chemical Society, [shows] that Earth’s observed average temperature should be about 15°C, and note that our atmosphere contains mostly Nitrogen (78%), Oxygen (21%) and Argon (0.9%) which makes up 99.9% of the total — leaving about one-tenth of one percent for the trace gases water (H2O and CO2). Temperature tampering temper tantrums. NSIDC Losing Their Ice Cubes. NSIDC shows no ice north of Barrow, AK.

N_20180817_extn_hires_v3.0.png (1461×1740) But visible satellite imagery shows lots of ice (red) there. NASA Imagery. Dr Zbigniew Jaworowski's criticism's of the assumed reliability of IPCC graphics merging pre-industrial CO2 data from ice cores with atmospheric measurements from 20C. CO2: The Greatest Scientific Scandal of Our Time by Zbigniew Jaworowski, M.D., Ph.D., D.Sc., March 2007 Read pdf paper of this strong critique of the IPCC from EIR Science 16 March 2007.
Canberra’s “hottest ever” September record due to thermometer changes and a wind profiler. With only a million dollars a day it’s hard for the BoM to keep up with their own stations.

Luckily Bill Johnston has arrived to help out for free. The BoM announced that it was Canberra’s hottest ever day last week, but forgot to check whether the heat was due to the site moving three times, changes in thermometers and a wind profiler they installed themselves in 2010. Are Claimed Global Record-Temperatures Valid? The New York Times claims 2016 was the hottest year on record. Click for article. Guest essay by Clyde Spencer Introduction The point of this article is that one should not ascribe more accuracy and precision to available global temperature data than is warranted, after examination of the limitations of the data set(s). One regularly sees news stories claiming that the recent year/month was the (first, or second, etc.) warmest in recorded history. “The most important point about our two experts’ measurements is this: like most scientific measurements, they would both have been useless, if they had not included reliable statements of their uncertainties.”
Errors in Estimating Temperatures Using the Average of Tmax and Tmin—Analysis of the USCRN Temperature Stations. Guest post by Lance Wallace Abstract The traditional estimate of temperature at measuring stations has been to average the highest (Tmax) and lowest (Tmin) daily measurements. This leads to error in estimating the true mean temperature. What is the magnitude of this error and how does it depend on geographic and climatic variables? Errors in Estimating Mean Temperature – Part II.