
The Shocking Climate Graph @climateofgavin Doesn’t Want You To See – Watts Up With That? Just a couple of days ago, climate scientist Dr.
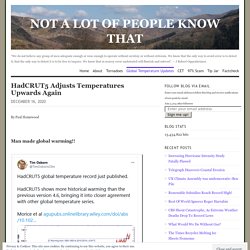
Roy Spencer suggested U.S. Warming Trends could be largely spurious. In his analysis, Dr. Spencer examined another dataset maintained by the National Oceanic and Atmospheric Administration (NOAA) and found that when adjusted for population density, weather stations used to measure climate trends report lower long term temperature trends: “… the highest population density stations had ~0.25 C/decade warming trend, with a reduced warming trend as population density was reduced…” He adds: “Significantly, extrapolating to zero population density would give essentially no warming in the United States during 1973-2011. He also cited my work published at AGU in 2015: HadCRUT5 Adjusts Temperatures Upwards Again. By Paul Homewood Man made global warming!!
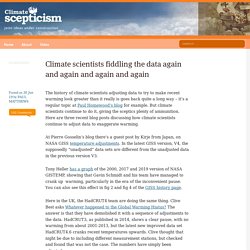
The Morice paper claims the extra warming has come from an improved representation of Arctic warming and a better understanding of evolving biases in sea‐surface temperature measurements from ships. In fact it is not scientific to average together Arctic temperatures with the rest of the planet, as it is comparing apples with oranges. It all has to do with latent heat and water vapour, as Tony Heller brilliantly explained: Climate scientists know all of this, so why do they continue to promote unscientific gibberish? While NASA Alters/Warms Greece Temperature Data, Cold And Unusual Snow Keep Coming Anyway! By Kirye and Pierre Gosselin So what’s going on?

NASA and other government agencies keep telling us that the globe is warming and ice becoming more rare, yet when look out the window, things often appear to be going the opposite direction. Rare cold, snow grip Greece For example, the Greek Reporter here informed how a “rare spring snow” blanketed large parts of northern Greece. It reported: “Of course, Northern Greece is used to low temperatures and snow, but even for their standards, such an intense snowfall in April is rare.” Moreover, the widely read Electroverse weather site here reported how southeast Europe had seen its “coldest April morning in a decade”, potentially causing widespread crop damage.
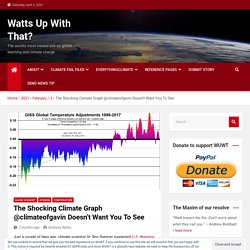
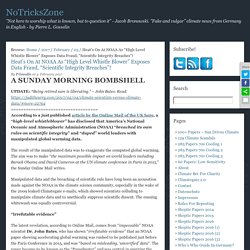
So why are such events happening when they aren’t supposed to be? Updated Review of Temperature Data. Columns in the chart show average temperature trends for four multi-decadal periods within the century depicted.

Update March 16, 2020 Several years ago I analyzed and compared temperature records from the highest quality US weather stations as assessed by surfacestations.org project. A recent discussion at WUWT reminded me that my report had no graphs to illustrate the finding, so the image above is provided in this update.
Japan--Temperature Data Issues. Canada--Temperature Data Issues. Australia and New Zealand- Temperature Data Adjustments. Arctic / Greenland / Iceland - Temperature Data Adjustments. The scandal of fiddled global warming data. When future generations try to understand how the world got carried away around the end of the 20th century by the panic over global warming, few things will amaze them more than the part played in stoking up the scare by the fiddling of official temperature data.

There was already much evidence of this seven years ago, when I was writing my history of the scare, The Real Global Warming Disaster. Climate scientists fiddling the data again and again and again and again. The history of climate scientists adjusting data to try to make recent warming look greater than it really is goes back quite a long way – it’s a regular topic at Paul Homewood’s blog for example.
But climate scientists continue to do it, giving the sceptics plenty of ammunition. Here are three recent blog posts discussing how climate scientists continue to adjust data to exaggerate warming. At Pierre Gosselin’s blog there’s a guest post by Kirje from Japan, on NASA GISS temperature adjustments. New Video : How Homogenization Destroys Climate Science. Tampering Past The Tipping Point. Yet another round of spectacular data tampering by NASA and NOAA. cooling the past and warming the present.
Spreadsheet Going back further, in 1990, the IPCC showed that earth was much warmer 800 years ago, when CO2 was 280 PPM during the Medieval Warm Period. ipcc_far_wg_I_chapter_07.pdf In 1974, NCAR showed that earth was no warmer than 1870, and was cooling rapidly. 21 Jul 1974, 13 – The Des Moines Register at Newspapers.com. BEST Adjustments. Heat’s On At NOAA As “High Level Whistle Blower” Exposes Data Fraud, “Scientific Integrity Breaches”!
UPDATE: “Being retired sure is liberating.” – John Bates.
Read: ===================================According to a just published article by the Online Mail of the UK here, a “high-level whistleblower” has disclosed that America’s National Oceanic and Atmospheric Administration (NOAA) “breached its own rules on scientific integrity” and “duped” world leaders with manipulated global warming data. Even more on the David Rose bombshell article: How NOAA Software Spins the AGW Game. Guest essay by Rud Istvan The disclosures by Dr.

Bates concerning Karl’s ‘Pausebuster’ NOAA NCEI paper have created quite the climate kerfuffle, with Rep. Smith even renewing his NOAA email subpoena demands. Former NOAA Scientist Confirms Colleagues Manipulated Climate Records. WASHINGTON – U.S.
House of Representatives Committee on Science, Space, and Technology members today responded to reports about the National Oceanic and Atmospheric Administration’s (NOAA) 2015 climate change study (“the Karl study”). According to Dr. John Bates, the recently retired principal scientist at NOAA’s National Climatic Data Center, the Karl study was used “to discredit the notion of a global warming hiatus and rush to time the publication of the paper to influence national and international deliberations on climate policy.”
Chairman Lamar Smith (R-Texas): “I thank Dr. John Bates for courageously stepping forward to tell the truth about NOAA’s senior officials playing fast and loose with the data in order to meet a politically predetermined conclusion. “Now that Dr. Oversight Subcommittee Chairman Darin LaHood (R-Ill.): “I applaud Dr. Dutch Climate 'Experts' Can't be Bothered to Explain Fake Data. A comparison of adjusted -vs- unadjusted surface data. Frank Lansner sends word of this paper in progress, relevant to the current discussions on the U.S. surface temperature record, and writes: In the attached article of mine I make an estimate of Hadcrut’s adjustments to us temperature data over the years.
They do not really resemble NOAA´s adjustments: – As if Hadcru finds reason to step-change in 1946 while NOAA don’t. And NOAAs (mostly TOBS) issues are supposed to take place around 1970-90, but this is not confirmed by Hadcrut. – Frank. The Greatest Scientific Fraud Of All Time. The Greatest Scientific Fraud Of All Time. Regular readers here will recognize that the "Greatest Scientific Fraud Of All Time" is the world temperature data tampering fraud, by which the guardians of the world surface thermometer temperature records seek to convince you that dangerous global warming is occurring by making downward "adjustments" to earlier year temperatures and hoping you won't notice.
To read Parts I to XVII of the series, go to this link, where you will find the prior 17 posts arranged in reverse chronological order. The last post in the series was August 14, 2017. There's a reason for the hiatus from then until now. It's because after a big El Niño and high temperatures in 2016, the El Niño dissipated, and temperatures came down somewhat in 2017. With temperatures failing to hit anything that could be plausibly characterized as records, NASA and NOAA took a break from their monthly breathless press releases proclaiming the current month or quarter or whatever to be the "hottest ever. " UPDATED: Do the Adjustments to Land Surface Temperature Data Increase the Reported Global Warming Rate? The pressing need for ever-upward temperature adjustments … A matter of life or death to the AGW hype. « Okulær.
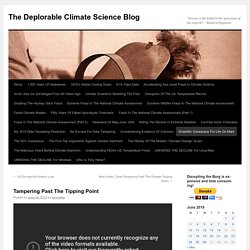
Manual Adjustments in the Temperature Record. I have been getting inquiries from folks asking me what I think about stories like this one, where Paul Homewood has been looking at the manual adjustments to raw temperature data and finding that the adjustments actually reverse the trends from cooling to warming. Here is an example of the comparisons he did: Raw, before adjustments; After manual adjustments I actually wrote about this topic a few months back, and rather than rewrite the post I will excerpt it below: I believe that there is both wheat and chaff in this claim [that manual temperature adjustments are exaggerating past warming], and I would like to try to separate the two as best I can.
At some level it is surprising that this is suddenly news. However, manual adjustments are not, as some skeptics seem to argue, wrong or biased in all cases. To these I will add a #7: The notion that satellite results are somehow pure and unadjusted is just plain wrong. On the adjustments to the HadSST3 data set. A Fairy Tale Of Two GHCN Cities. Buenos Aires and La Estanzuela are located 35 miles apart across the water. Buenos Aires is a massive heat island, and La Estanzuela is a small town of a few thousand people. Buenos Aires warmed tremendously from 1931 to 1995, the period of record for the La Estanzuela station.
La Estanzuela temperatures cooled during that same period, and the frequency of hot days plummeted. The two degree warming trend at Buenos Aires is bogus. Since 2008, 0.24°C Of ‘Extra’ Warming Has Been Added To NASA’s 1910-2000 Global Temperatures. By Kenneth Richard on 19. Yes, NOAA must adjust data — but its climate record really is quite wrong. New York’s Temperature Record Massively Altered By NOAA. Adjusting Measurements to Match the Models – Part 1: Surface Air Temperatures. In his recent Data Adjustment Bureau post Euan Mearns added a footnote in which he asked for “more examples of climate data being adjusted to make it match the theory.” In previous posts we have addressed a number of such examples individually, and compiling them into a group of posts (there are too many to deal with in just one) struck me as a good idea.
Warming in the USHCN is mainly an artifact of adjustments. Dr. Roy Spencer proves what we have been saying for years, the USHCN (U.S. Instability of GHCN adjustment algorithm. More Data Manipulation By NOAA, NASA, HadCRUT…Cooling The Past, Warming the Present. Thousands Of Non-Urban Thermometers Removed 0.3°C Of Pause-Busting Warmth Added Since 1998. NOAA Still Falsifying Icelandic Climate History. The Completely Fake Time Of Observation Bias. How to lie with maps and smoothing – NASA GISS in Antarctica.
And now, the most influential station in the GISS record is … Guest post by John Goetz #17 - Selinsgrove, PA (in 2003) The GISS temperature record, with its various adjustments, estimations, and re-estimations, has drawn my attention since I first became interested in the methods used to measure a global temperature. In particular, I have wondered how the current global average can even be compared with that of 1987, which was produced using between six and seven times more stations than today. Commenter George E. GISS Swiss Cheese. The Deplorable Climate Science Blog. Homogenised temperatures, and planning for bushfires - On Line Opinion - 1/9/2016.
The ship-buoy bias correction excuse (HadSST3 and ERSSTv4) « Okulær. An oddity in the Karl et al. 2015 buoy data adjustments. On the Integrity of the NASA/NOAA Temperature Record, Olympia Washington February 7 2017 3. TOBS At Ithaca. Climate scientists versus climate data. Response to critiques: Climate scientists versus climate data. The Changing Climate of Global Warming. NOAA Ramps Up Their Climate Fraud In September.
All Temperature Adjustments Monotonically Increase. Why Automatic Temperature Adjustments Don’t Work. Revealed: IPCC Adds 0.3°C Of Phantom Warming Between 3rd, 5th Reports … Met Office Removes 0.3°C From 1880s-1940s Warming. Desperation — who needs thermometers? Sherwood finds missing hot spot with homogenized “wind” data. Homogenization of Temperature Data By the Bureau of Meteorology. Investigation of methods for hydroclimatic data homogenization – ITIA. Temperature Data Review Project–My Submission. Contribution of USHCN and GISS bias in long-term temperature records for a well-sited rural weather station. Problematic Adjustments And Divergences (Now Includes June Data)
Analysis of the Relationship Between Land Air Temperatures and Atmospheric Carbon Dioxide Concentrations. Changes to the GISS Land Surface Air Temperature-Based Dataset Have Increased Reported Long-Term Global Warming. Robust Evidence NOAA Temperature Data Hopelessly Corrupted By Warming Bias, Manipulation. NASA’s Gavin Schmidt Says He Can’t Be Held Responsible For The Fraudulent Data He Publishes. Watts Up With That?