

Biased Media Reporting on the New Santer et al. Study Regarding Satellite Tropospheric Temperature Trends – Watts Up With That? Reposted from Dr.

Roy Spencer’s Blog June 9th, 2021 by Roy W. Spencer, Ph. D. HadCRUT5 shows 14% more global warming since 1850 than HadCRUT4 – Watts Up With That? By Christopher Monckton of Brenchley They’re at it again.
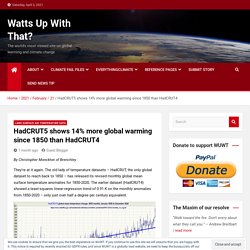
The old lady of temperature datasets – HadCRUT, the only global dataset to reach back to 1850 – has released its revised monthly global mean surface temperature anomalies for 1850-2020. Calibrating the CERES Image of the Earth’s Radiant Emission to Space. UAH, RSS, NOAA, UW: Which Satellite Dataset Should We Believe? Reposted from Dr.
Roy Spencer’s Blog April 23rd, 2019 by Roy W. Is Satellite Altimeter-based Sea Level Rise Acceleration from a Biased Water Vapor Correction? SUMMARY: Evidence is presented that an over-correction of satellite altimeter data for increasing water vapor might be at least partly responsible for the claimed “acceleration” of recent sea level rise.
UPDATE: A day after posting this, I did a rough calculation of how large the error in altimeter-based sea level rise could possibly be. The altimeter correction made for water vapor is about 6 mm in sea level height for every 1 mm increase in tropospheric water vapor. The trend in oceanic water vapor over 1993-2018 has been 0.48 mm/decade, which would require about [6.1 x 0.48=] ~3 mm/decade adjustment from increasing vapor.
Weather satellite wanders through time, space, causing stray warming to contaminate data. In the late 1990s, the NOAA-14 weather satellite went wandering through time and space, apparently changing the record of Earth's climate as it went.
Designed for an orbit synchronized with the sun, NOAA-14's orbit from pole to pole was supposed to cross the equator at 1:30 p.m. on the sunlit side of the globe and at 1:30 a.m. on the dark side, 14 times each day. One of the instruments it carried was a microwave sounding unit (MSU), which looked down at the world and collected data on temperatures in Earth's atmosphere and how those temperatures changed through time. UAH finds a warming error in satellite data, lowers “tropical hotspot” temperature trend, contradicts IPCC models. From the University of Alabama, Huntsville via email from Dr.
John Christy. Weather Satellite Wanders Through Time, Space, Causing Stray Warming to Contaminate Data In the late 1990s, the NOAA-14 weather satellite went wandering through time and space, apparently changing the record of Earth’s climate as it went. Designed for an orbit synchronized with the sun, NOAA-14’s orbit from pole to pole was supposed to cross the equator at 1:30 p.m. on the sunlit side of the globe and at 1:30 a.m. on the dark side, 14 times each day. Roy Spencer On Satellite v Surface Data. By Paul Homewood With the continuing divergence of surface and satellite temperature records, it is worth revisiting what Roy Spencer had to say on the issue in 2014: Much is being made of the “global” surface thermometer data, which three-quarters the way through 2014 is now suggesting the global average this year will be the warmest in the modern instrumental record.
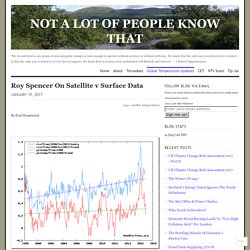
I claim 2014 won’t be the warmest global-average year on record. ..if for no other reason than this: thermometers cannot measure global averages — only satellites can. Mystery solved: Rain means satellite and surface temps are different. Climate models didn’t predict this… A funny thing happens when you line up satellite and surface temperatures over Australia.
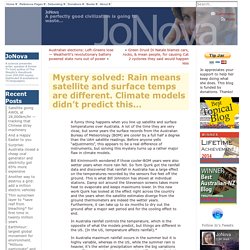
A lot of the time they are very close, but some years the surface records from the Australian Bureau of Meteorology (BOM) are cooler by a full half a degree than the UAH satellite readings. Before anyone yells “adjustments”, this appears to be a real difference of instruments, but solving this mystery turns up a rather major flaw in climate models. Bill Kininmonth wondered if those cooler-BOM years were also wetter years when more rain fell. So Tom Quirk got the rainfall data and discovered that rainfall in Australia has a large effect on the temperatures recorded by the sensors five feet off the ground.