
Much of the surface temperature record has been contaminated with warming effects from urban landscapes, and many question how and why historical data has been adjusted to indicate warming. Claim: Global Warming May have Started in 1825 – Watts Up With That? Guest essay by Eric Worrall h/t Tallbloke; According to researchers working in the Paracel Islands, the modern warming period began in 1825, before anthropogenic CO2 could possibly have had any effect on the global climate.
I can’t find a link to the study so if anyone finds one please post it in the comments. The Paracel Islands, like the better known Spratly Islands, are a contested territory in the South China Sea and a potential future geopolitical flashpoint. If Tao Shichen’s team is correct, this study adds to the evidence that the modern warming has a significant natural forcing component. Extensively-Referenced Study Of Past Scientists’ Global Temperature Estimates Suggests ‘No Change’ In 100 Years. By Kenneth Richard on 13.
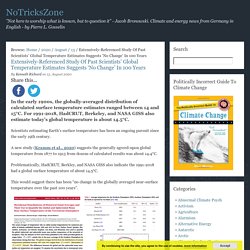
August 2020 In the early 1900s, the globally-averaged distribution of calculated surface temperature estimates ranged between 14 and 15°C. For 1991-2018, HadCRUT, Berkeley, and NASA GISS also estimate today’s global temperature is about 14.5°C. Scientists estimating Earth’s surface temperature has been an ongoing pursuit since the early 19th century.
Two New Temperature Records Show No Warming In Central Asia Since 1766 A.D. Or In Spain Since 1350 A.D. By Kenneth Richard on 10.
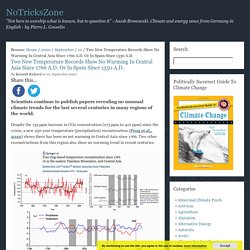
September 2020 Scientists continue to publish papers revealing no unusual climate trends for the last several centuries in many regions of the world. Despite the 135 ppm increase in CO2 concentration (275 ppm to 410 ppm) since the 1700s, a new 250-year temperature (precipitation) reconstruction (Peng et al., 2020) shows there has been no net warming in Central Asia since 1766. Two other reconstructions from this region also show no warming trend in recent centuries. Image Source: Peng et al., 2020. New Study: ‘The Most Suitable Place In The World For Temperature Reconstruction’ Shows Net Cooling Since The 1930s. By Kenneth Richard on 2.

July 2020 A new 1876-present temperature reconstruction for Northern Finland shows the 1930s were the warmest period of the last 140 years. And there has been no net warming since. Tree density analysis, MXD, has a “more prominent association with temperature” than measuring tree ring widths because it can more clearly separate precipitation factors affecting tree growth from temperature-limiting factors (Bjorklund et al., 2020). Record High Temperatures.
Regional Cooling. The Hiatus/Pause. Modern Warm Period: Arctic and Far North. Modern Warm Period: Antarctica. Modern Warm Period: North America. Modern Warm Period: UK. Modern Warm Period: Europe and Russia. Modern Warm Period: Asia and India. Modern Warm Period: Australia and New Zealand. Early 20th Century Global Warming. New findings from the Neotropics suggest contraction of the ITCZ. News Release 14-Feb-2020 Warmer climate leads to current trends of social unrest and mass migration University of New Mexico The University of New Mexico research team was led by Professor Yemane Asmerom (3rd from left) and included (l. to r.): Valorie Aquino, Keith Prufer and Victor Polyak.

170 Years of Earth Surface Temperature Data Show No Evidence of Significant Warming. Author: Thomas K.
Bjorklund, University of Houston, Dept. of Earth and Atmospheric Sciences October16, 2019 Key Points 1. Warming Twice As Fast. Hiding The Decline At Berkeley Earth. Zeke from Berkeley Earth shows the whole earth burning up since 1960, particularly the Arctic – which has warmed “by more than 4C.
Zeke Hausfather on Twitter: “The world as a whole has warmed by 0.9C just since 1960, with some parts of the Arctic warming by more than 4C. Here is a map of warming between January 1960 and August 2019: / Twitter He shows Antarctic warming, which NASA wrote in 2004 had cooled significantly. Pubs.GISS: Abstract of Shindell and Schmidt 2004 SVS: Antarctic Heating and Cooling Trends Satellites show no warming in Antarctica, since 2004 – so we can see that the Berkeley earth trends for Antarctica are incorrect. RSS / MSU and AMSU Data / Time Series Trend Browser There was almost no sea ice around Antarctica in January 1976. Controversy Swirls As Numbers Don’t Add Up… 1.3°C Missing Heat! – Earth Supposed To Be 16°C, But It’s Only 14.68°C. Even NASA says it: Without the Earth’s greenhouse gases (GHG) in the atmosphere, the planet would be on average a frigid -18°C.

But because of the preindustrial 280 ppmv CO2 and other GHGs in our atmosphere, the average temperature of the Earth thankfully moves up by 33°C to +15°C (see chart below), based on the Stefan Boltzmann Law. Global warming theorists say the Earth’s surface preindustrial temperature was supposed to be 15°C. And today CO2 is supposed to have warmed it another degree, to 16°C. Image: www.klimamanifest.ch. 1970s: Earth Warmed 0.6°C From 1880-1940 And Cooled -0.3°C From 1940-1970. Now It’s 0.1°C And -0.05°C. By Kenneth Richard on 25.

July 2019 Image Source: National Academy of Sciences, Understanding Climatic Change. There Has Been Just 0.1°C Of Unremarkable ‘Global Warming’ In The Last 50 Years. By Kenneth Richard on 18.
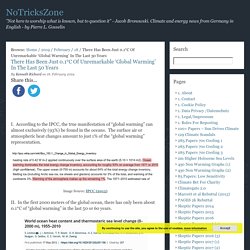
February 2019 I. According to the IPCC, the true manifestation of “global warming” can almost exclusively (93%) be found in the oceans. The surface air or atmospheric heat changes amount to just 1% of the “global warming” representation. Image Source: IPCC (2013) 265 Papers Published Since 2017 Subvert The Claim That Post-1850s Warmth Has Been Unusual, Global. By Kenneth Richard on 31. January 2019 Dangerous, Unprecedented, Globally Pervasive Image Source: Lansner and Pepke Pedersen, 2018. Reconstructing a dataset of observed global temperatures 1950-2016 from human and natural influences. By Frank Bosse A demonstration that multidecadal variation since 1950 leads to overestimation of the Transient Climate Response (TCR). Introduction Inspired by a recent paper ( Folland et.al 2018), I try to replicate the annual development of the observed global mean surface temperature (GMST) for 1950-2016 with a minimum of fitting and smoothing.
Unlike it was done in Folland et.al I don’t want to break the time series into sub-periods nor use monthly data when annual data seem to be sufficient. The 1.5 degree Objective - …The 1.5 degree Objective… There’s a great deal of media attention being given to the IPCC’s latest report and the idea that we should keep temperature rise below 1.5 degrees. Let’s step back to the year 1870, and assume that the IPCC, or whatever it might have been called then, if it had been in existence, had just realized that the industrial revolution was going to result in atmospheric CO2 levels doubling, from the existing 280 ppm, over the next hundred years.
The writers of the day would, of course, have picked up on the need to maintain the existing Goldilocks environment. The climate was good in 1870. We were no longer living in the extreme cold of the Little Ice Age of the 1600s, and we certainly didn’t want to allow temperatures to get too warm, or rise more than 1.5 degrees.
A 1.5 degree temperature rise would create Hot House Earth, while our climate was just right … the Goldilocks Climate. Distinguishing Between ‘Safe’ or ‘Dangerous’ Warming Is Easy: ‘Dangerous’ Warming Is Red. When Michael Mann and the IPCC coordinated efforts to make the Medieval Warm Period disappear from the paleoclimate record in the early 2000s, they employed the visually slick and effective tactic of adding red to the “dangerous” warming trend, and blue to the “safe” cooling trend. The original Mann et al. (1998, 1999) graph that claimed to reconstruct surface temperatures for the entire Northern Hemisphere (by extrapolating from a few select trees located in North America) was published without color.
It’s Here: A 1900-2010 Instrumental Global Temperature Record That Closely Aligns With Paleo-Proxy Data. A global-scale instrumental temperature record that has not been contaminated by (a) artificial urban heat (asphalt, machines, industrial waste heat, etc.), (b) ocean-air affected biases (detailed herein), or (c) artificial adjustments to past data that uniformly serve to cool the past and warm the present . . . is now available. Composed of 450 instrumental records from temperature stations sheltered from ocean-air/urbanization/adjustment biases throughout the world, a new 20th/21st century global temperature record introduced previously here very closely aligns with paleoclimate evidence from tree rings, ice cores, fossil pollen and other temperature proxies.
The Alignment Of Paleoclimate Proxy Data & Instrumental Records In 2016, Dr. New paper shows issues with temperature records: Comparing the current and early 20th century warm periods in China. Guest post by Dr. Willie Soon, Dr. Another Warming ‘Hole’? Observations Show The North Atlantic COOLED By -0.8°C/Century Since 1800s. By Kenneth Richard on 14. June 2018 In a new paper, scientists document another long-term cooling trend, this time in the North Atlantic’s sea surface temperatures. Alarmism Takes A Big Hit…Flood Of New Scientific Findings Show Nothing Unusual Happening Climatically. Two days ago Kenneth presented an impressive flurry of scientific, peer-reviewed charts published over the past 15 months (46 alone in 2018).
Much to the surprise of alarmist scientists, global warming is weak at best. Lack of warming a global phenomenon. NASA James Hansen, Gavin Schmidt Paper: 10 More Years of Global Warming Pause (Maybe) Guest essay by Eric Worrall h/t Benny Peiser / GWPF – Former NASA GISS Director James Hansen and current director Gavin Schmidt think nature may conspire of the next ten years to produce the impression of an ongoing pause in global warming. Though of course it may not. On the Integrity of the NASA/NOAA Temperature Record, Olympia Washington February 7 2017. Forbes: Climate Change Caused by Anthropogenic CO2. Guest essay by Eric Worrall According to climatologist Brian Brettschneider only anthropogenic CO2 can possibly be the cause of recent global warming. 18 New Papers Link High Solar Activity To Medieval And Modern Warmth, Low Solar Activity To Little Ice Age Cooling. “It is generally accepted that the climate warms during periods of strong solar activity (e.g., the Medieval Warm Period) and cools during periods of low solar activity (e.g., the Little Ice Age).”
—Lyu et al., 2016. 1986 – The Year When Climate Fraud Reached A Tipping Point. On March 29, 1986 almost the entire country was over 70 degrees, with temperatures above 100 degrees in California. CO2 was below 350 PPM. The only other years with similar warmth on March 29 were 1910, 1946 and 1968. A few weeks later, NASA’s James Hansen was ramping up his global warming insanity, spreading wild mispredictions and flat out lies. 25 New Papers Confirm A Remarkably Stable Modern Climate: Fewer Intense Storms, Hurricanes, Droughts, Floods, Fires… It has by now become common practice for just about any and every unusual weather occurrence, extreme temperature anomaly, or seismic event to be somehow, someway linked to the human practice of using energy derived from fossil fuels. No hurricane, flood, drought, storm, wildfire … is spared from potential anthropogenic implication.
17 New (2017) Scientific Papers Affirm Today’s Warming Is Not Global, Unprecedented, Or Remarkable. By Kenneth Richard on 26. January 2017. New Paper: 14 Scientists Affirm Solar Forcing, Not CO2, Is ‘Dominant Control’ For Modern Climate Change. Mainstream Media Ignores New Study: Present Sea Surface Temperatures “Indistinguishable” From Those During Last Interglacial… Could A New Global Temperature Reconstruction Using Ice Cores Be More Accurate Than The Instrumental Record? Record Daily Temperature Fraud On The Rise.